
LightPoint: BookMon
ON-GOING PROJECT AS OF APRIL 25TH, 2018
A Trading Platform for Portfolio Managers and Traders

Introduction
LightPoint Financial Technology is a financial technology company that provides solutions to hedge funds, investment banks, and asset managers. LightPoint offers a product suite called Front Office for portfolio managers and traders to manage their books.
role
Designer & Developer
team structure
1 designer/developer
1 mid-level developer
activities
User research
Sketching and lo-fidelity designs
High-fidelity UI designs
Wireframing
Usability testing
UI Development
Goals & Requirements
business goal
LightPoint wants to build the next-generation of Front Office, a collection of tools to equip users make best portfolio management decisions and executions, ranging from security to trades. The suite is used by numerous types of users such as Compliance, DevOps, Management, Portfolio Managers, and more. LightPoint has decided to first focus on Book Monitor, a trading platform for portfolio managers and traders.
business requirements
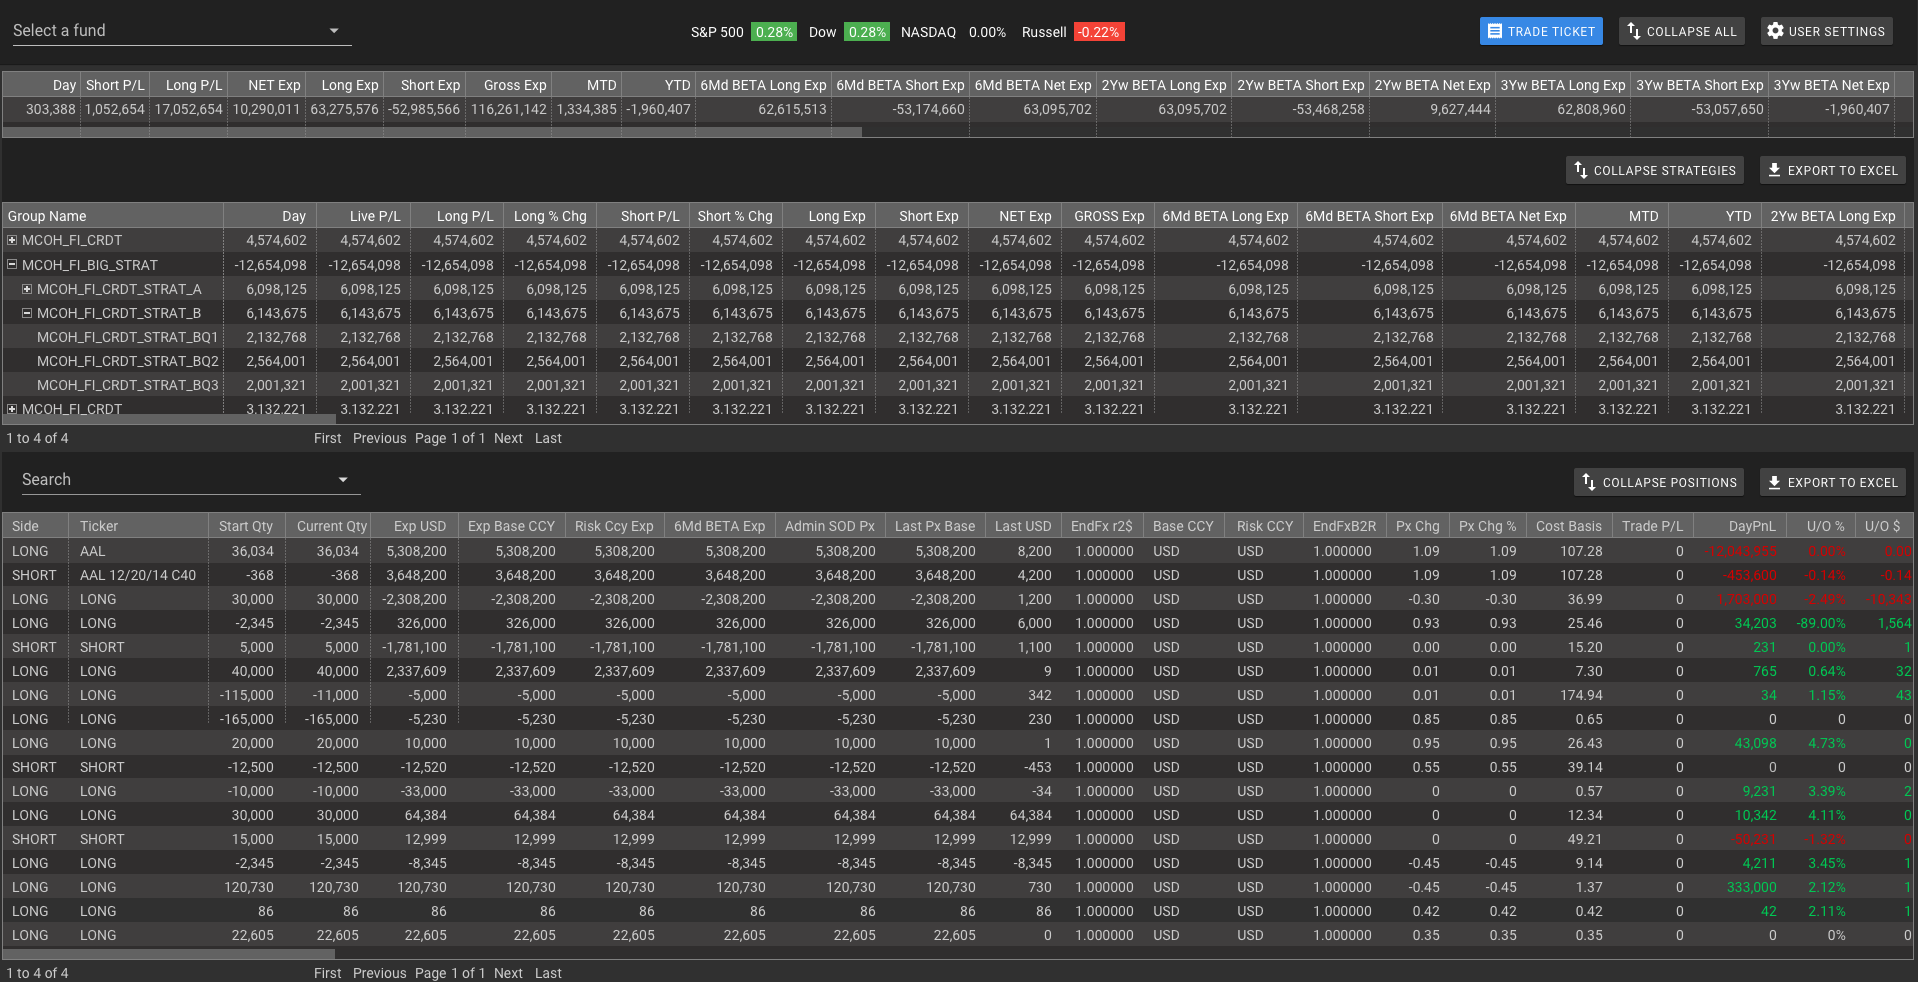
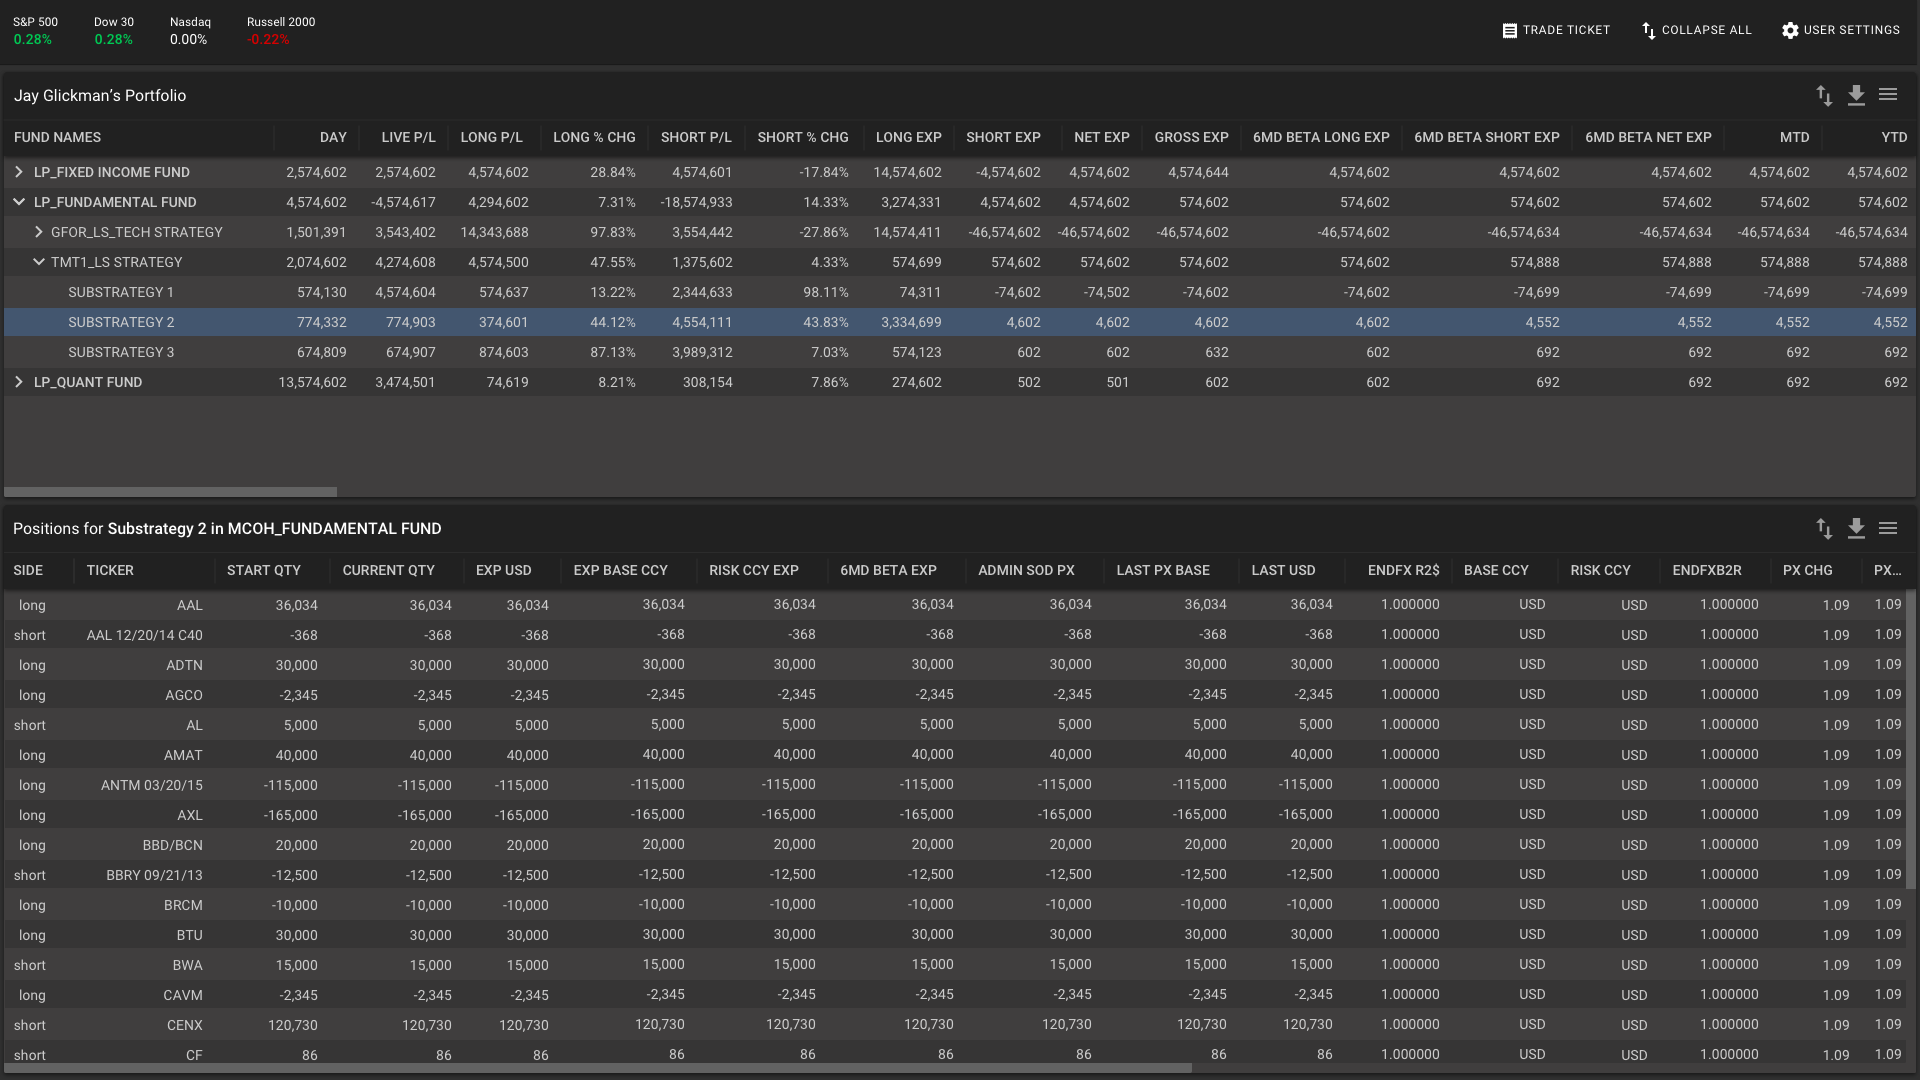
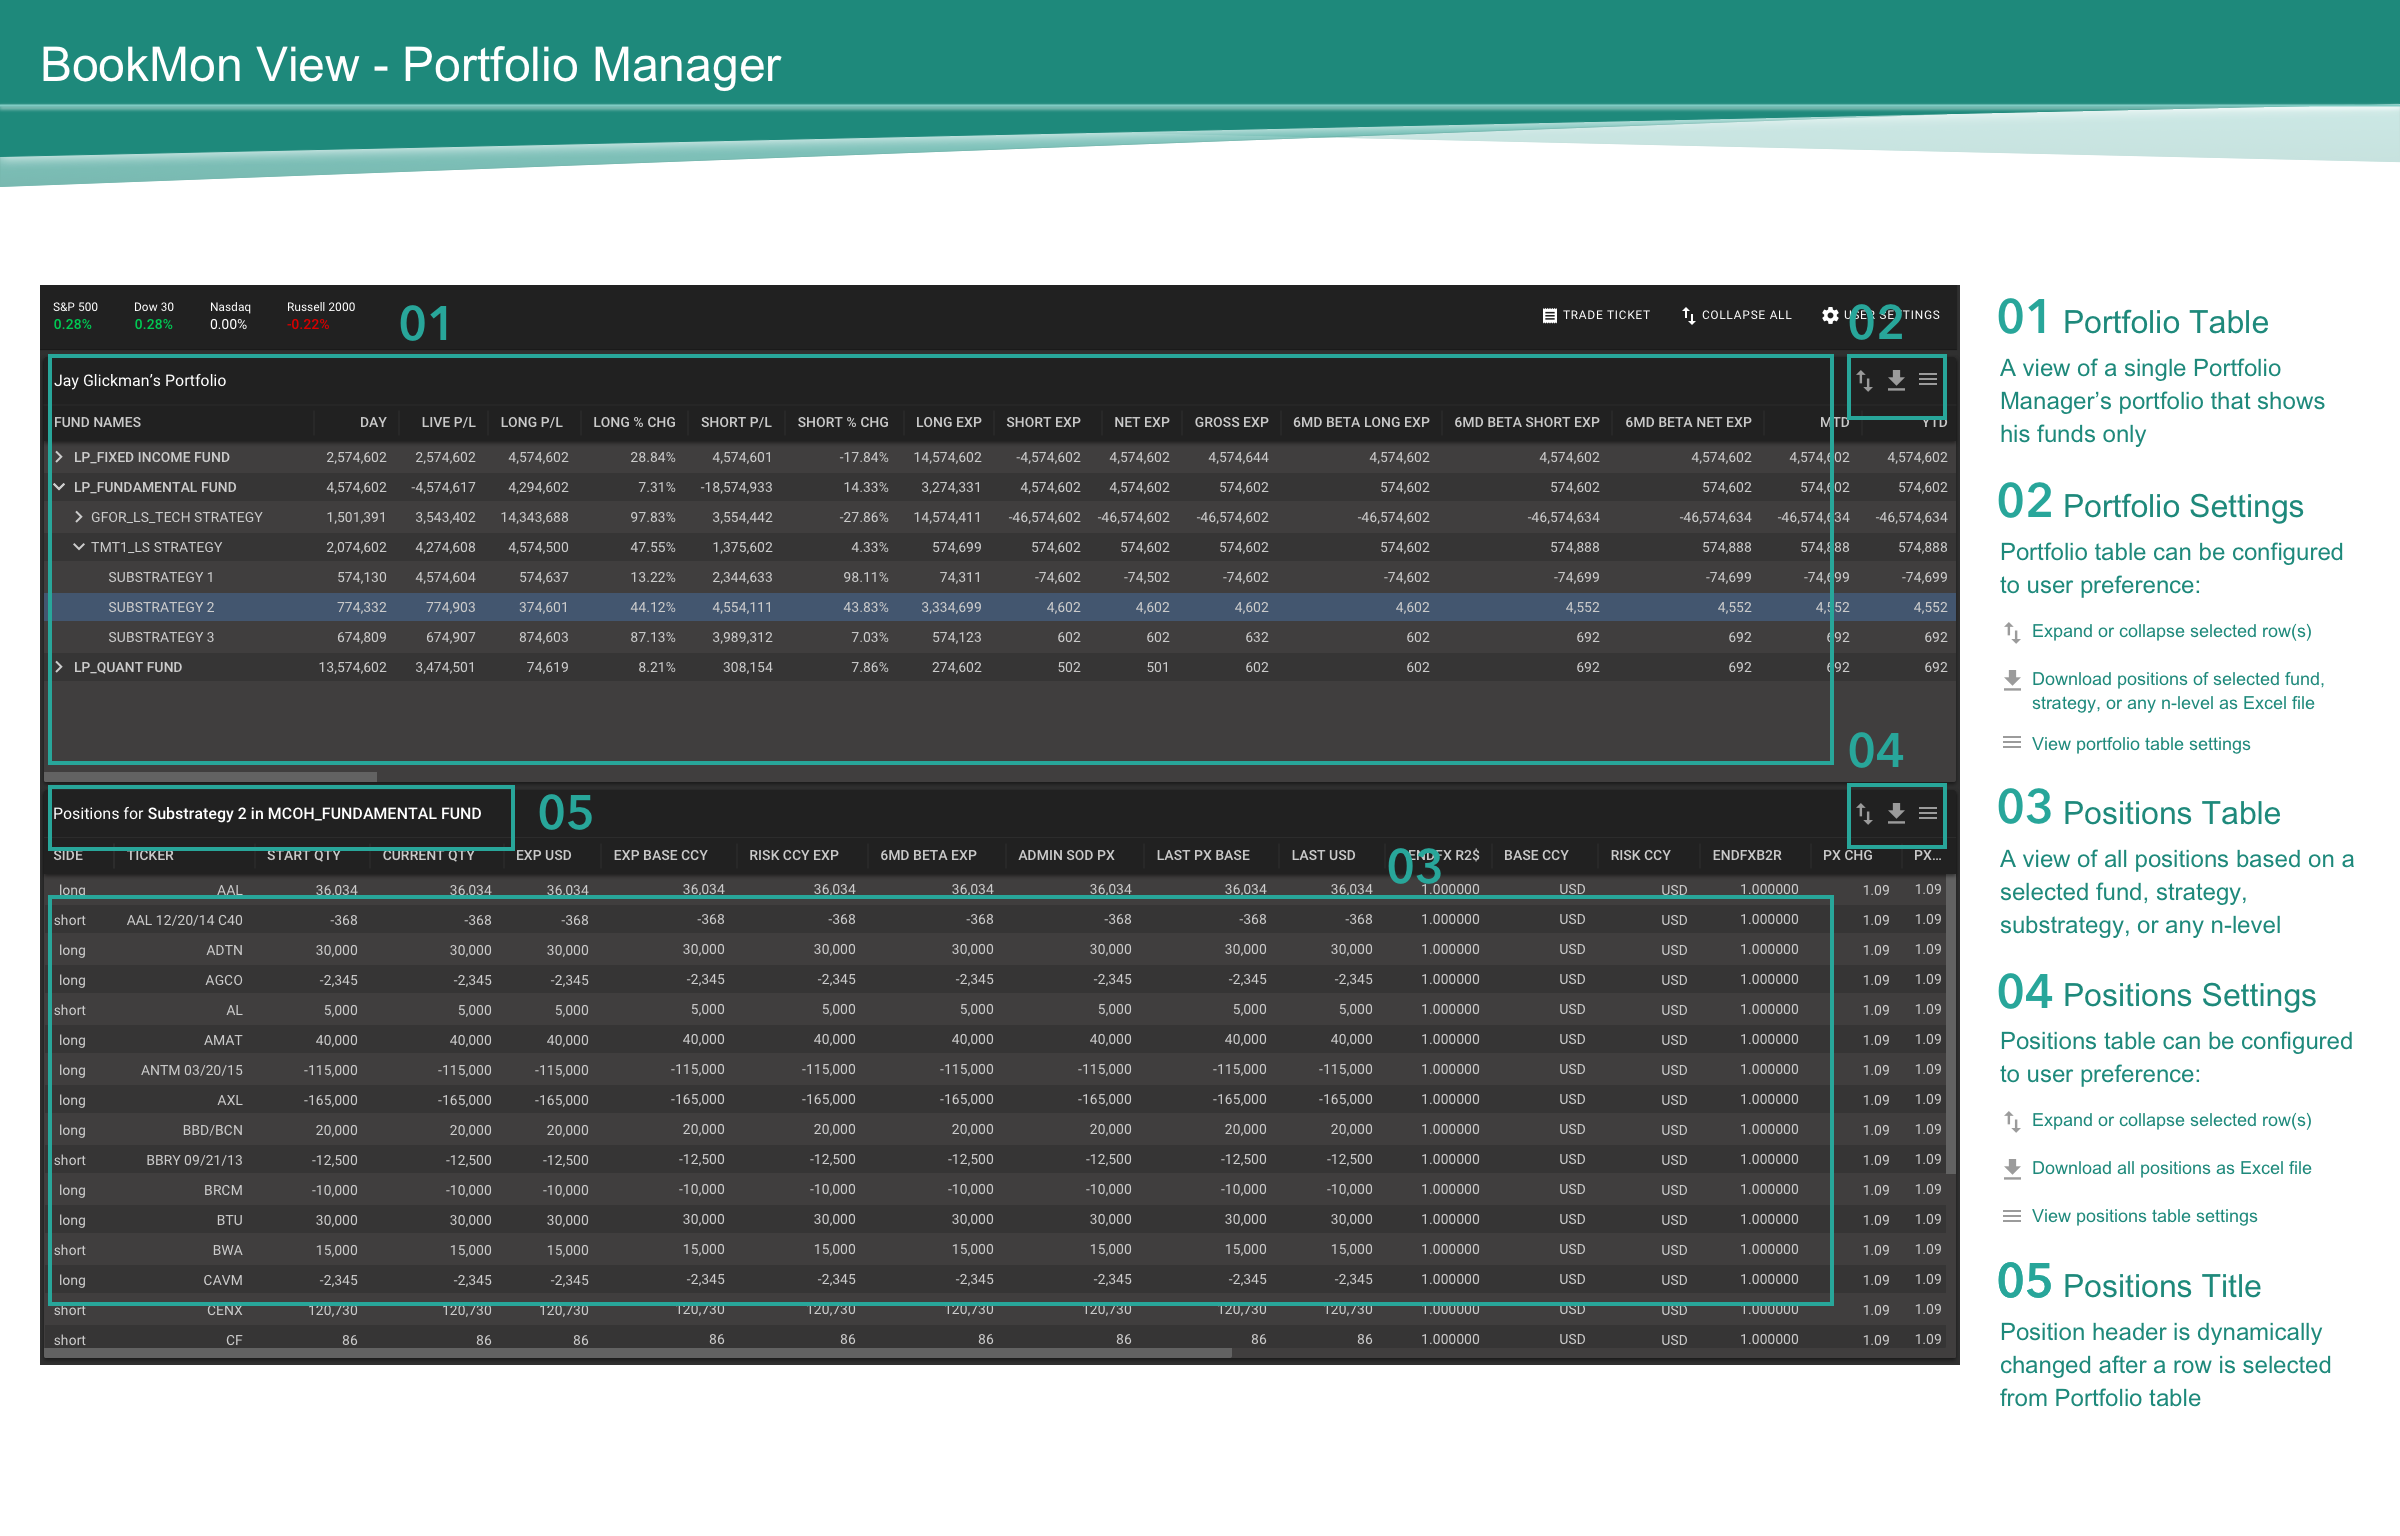
- Show fund-levels and n-levels for portfolio managers and traders
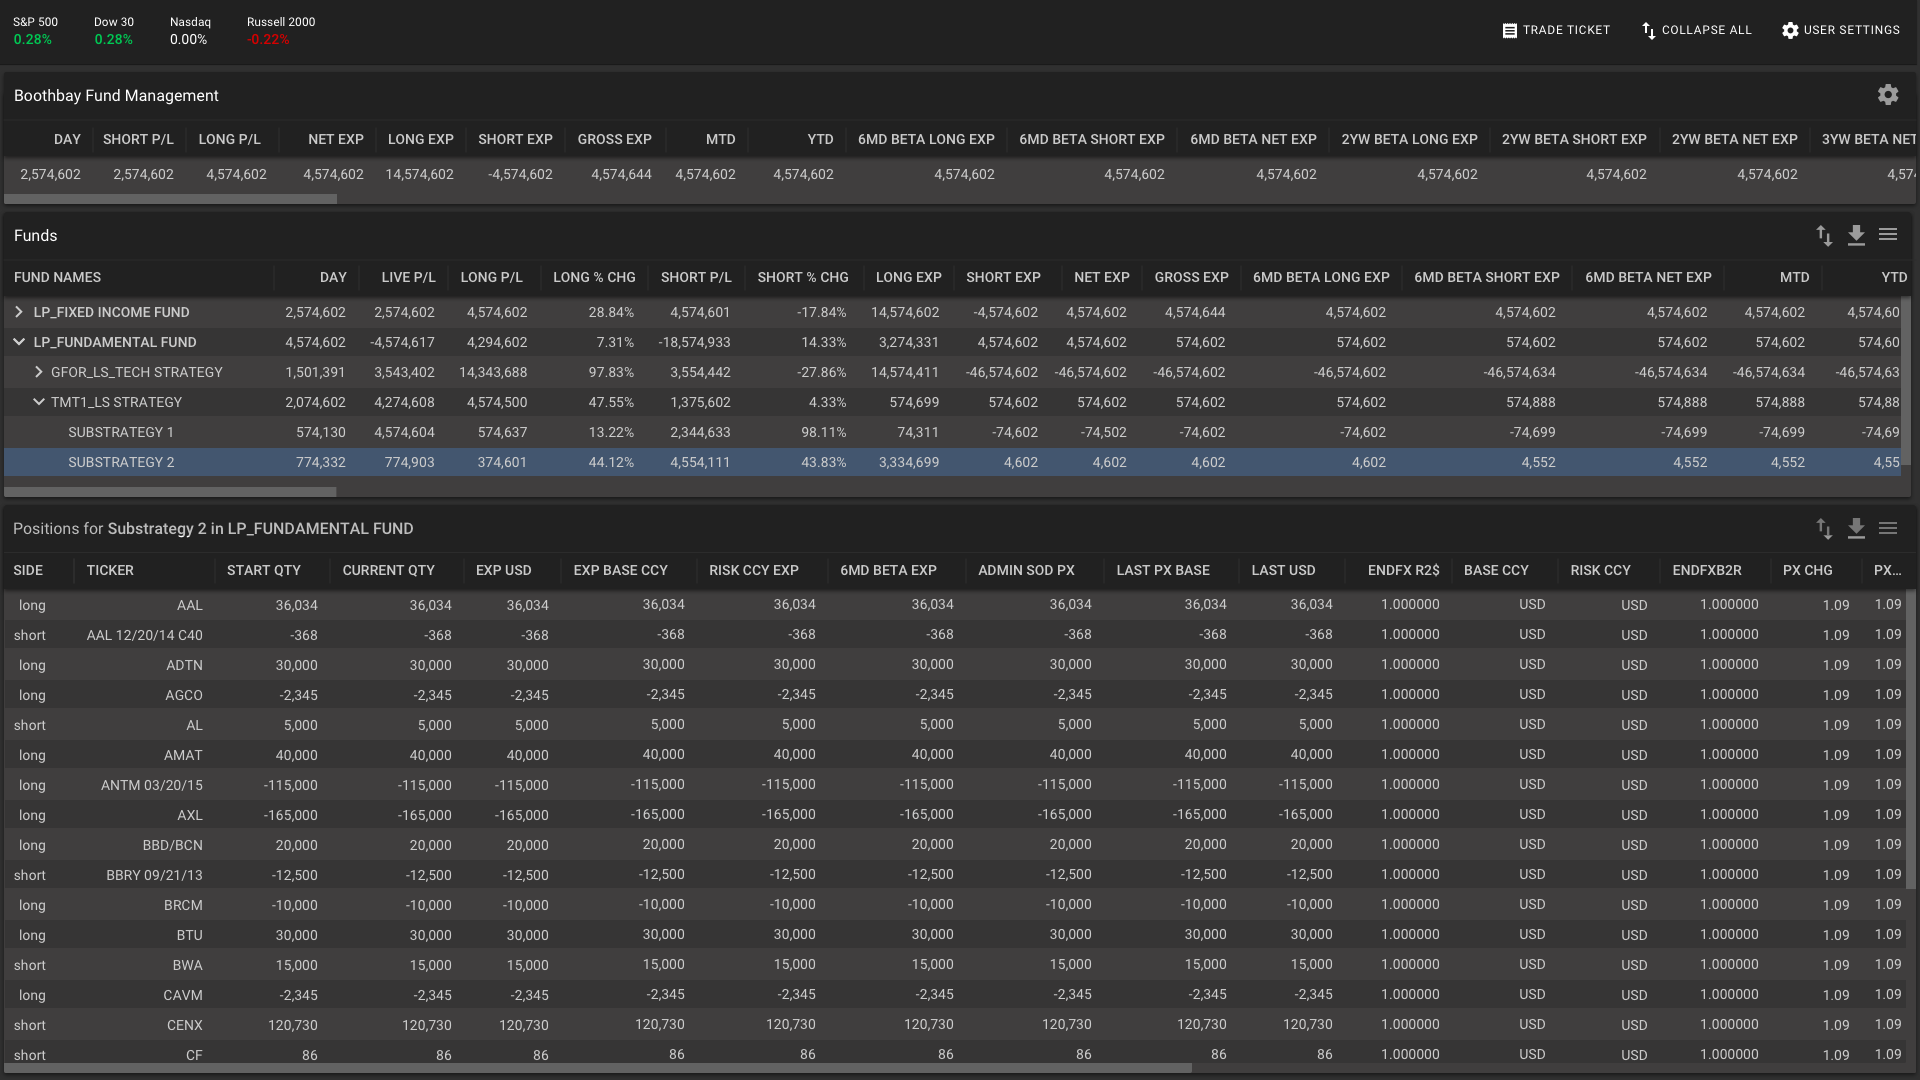
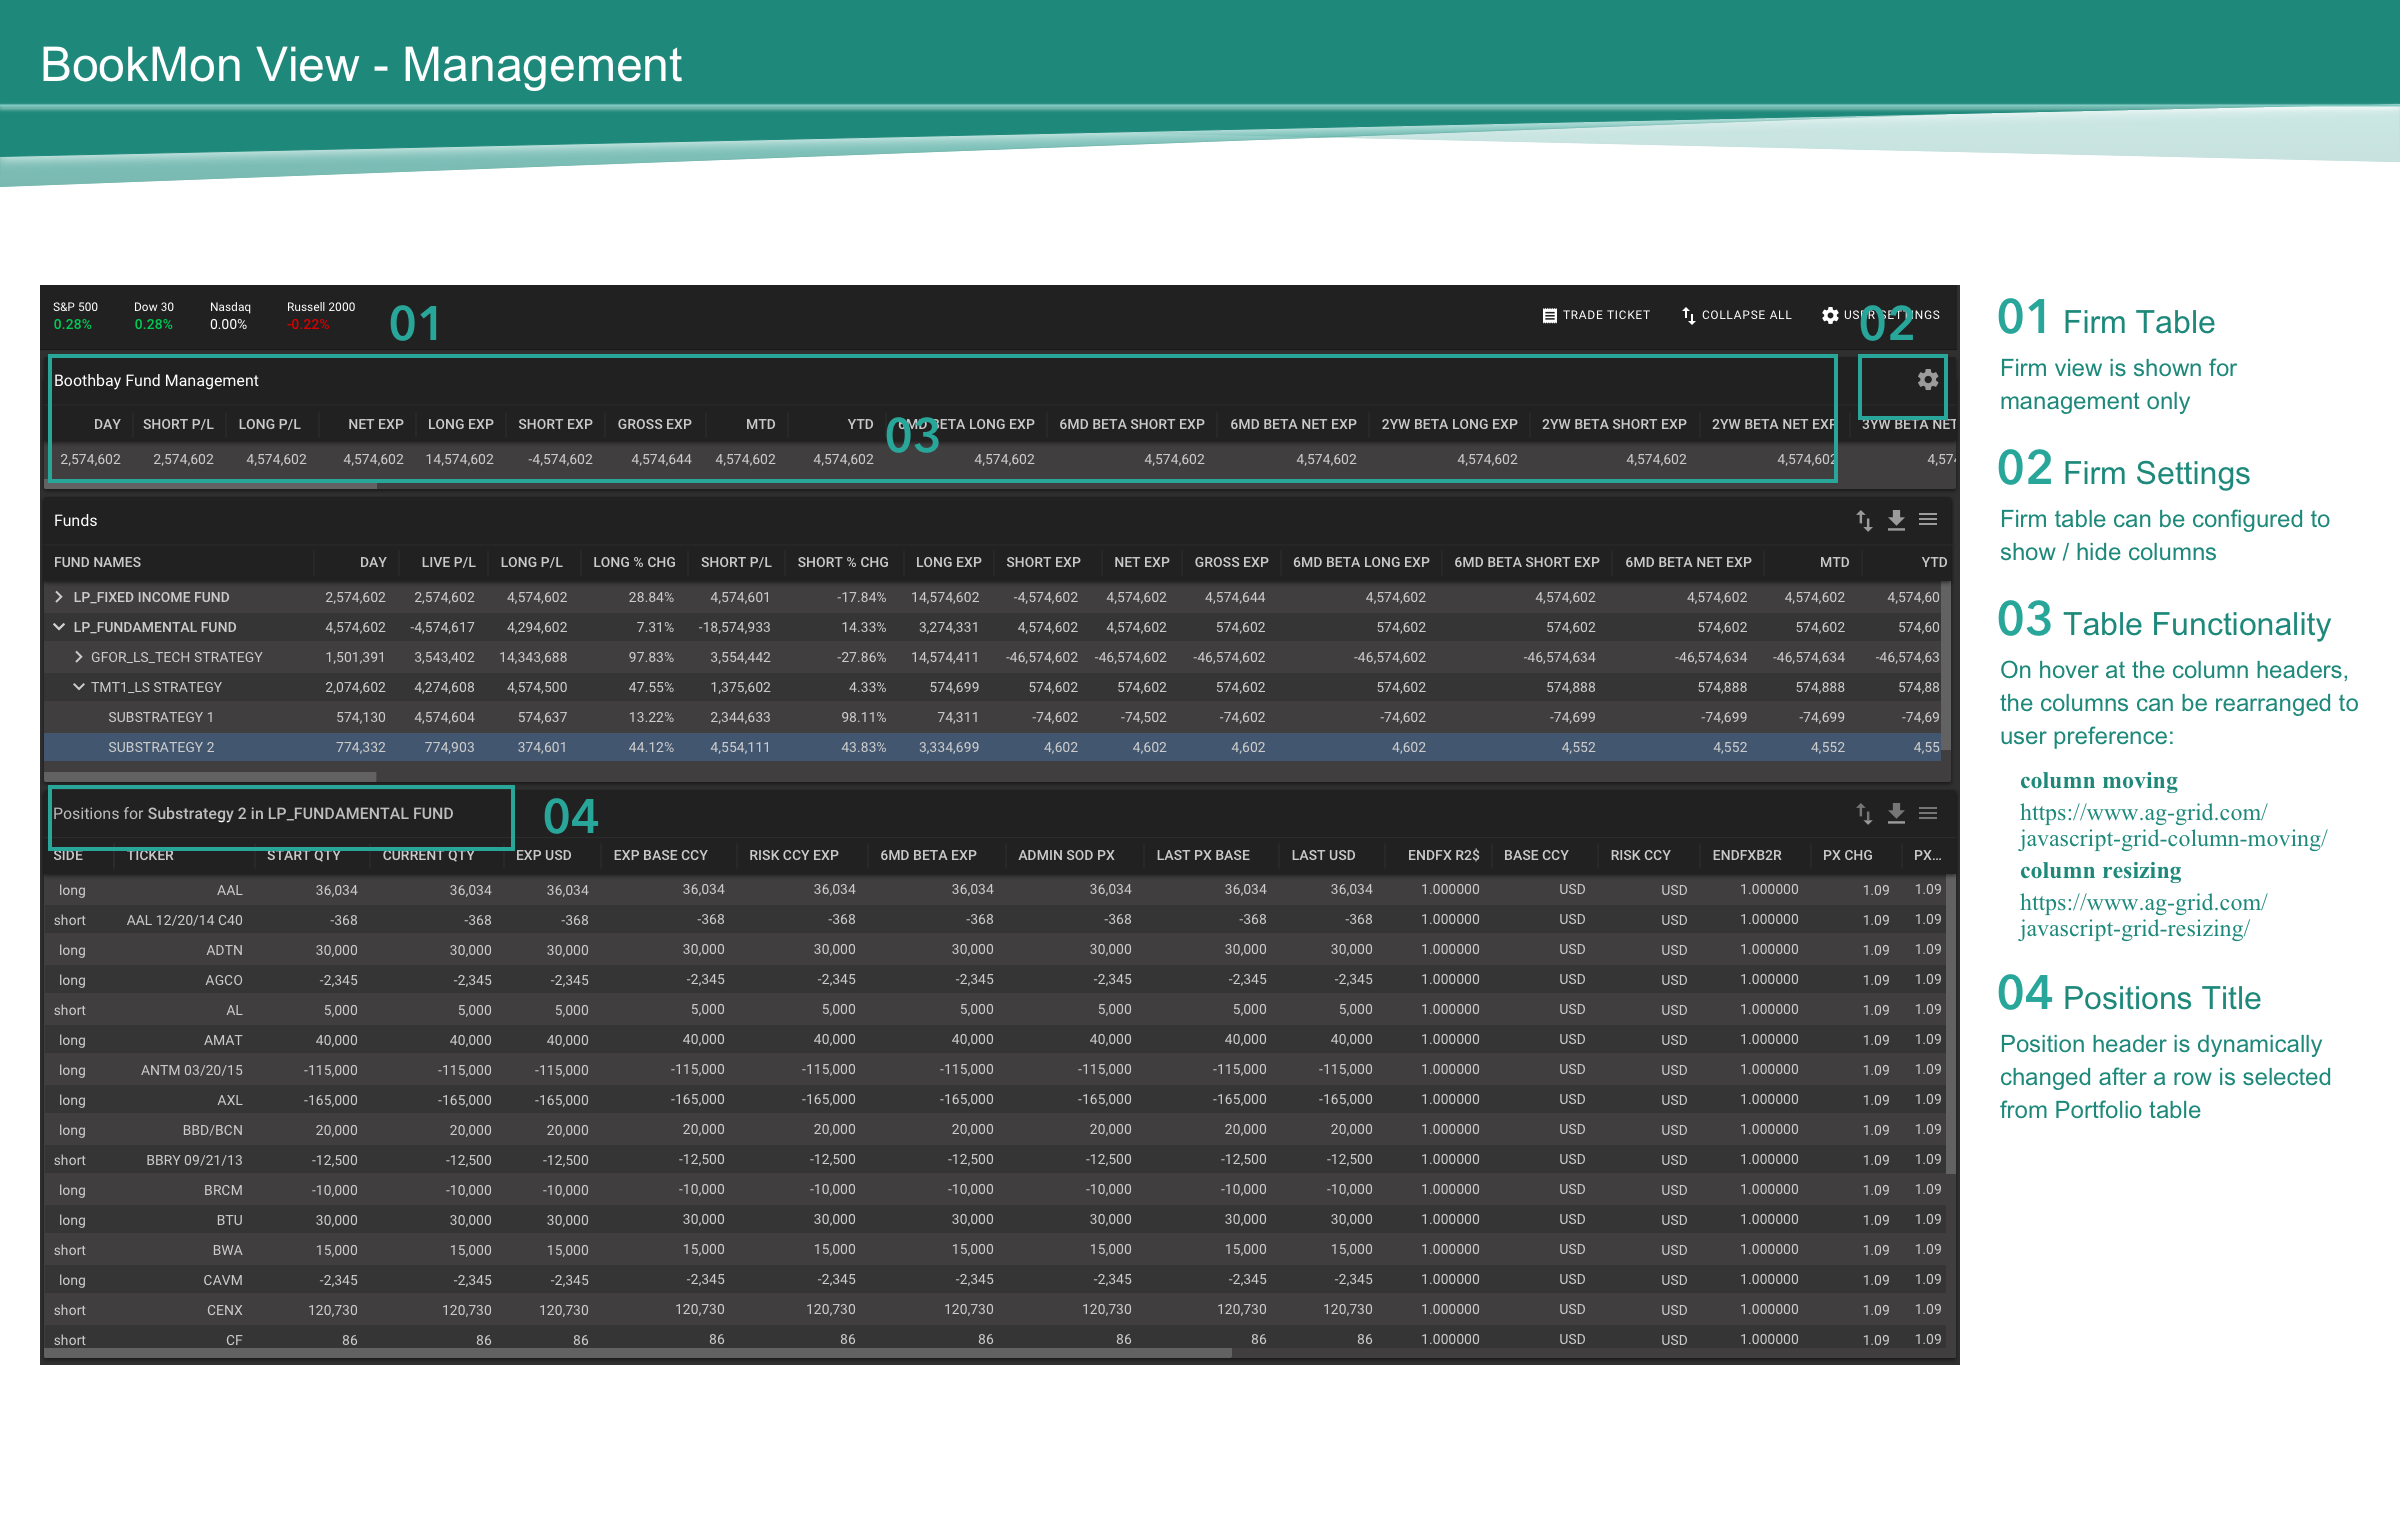
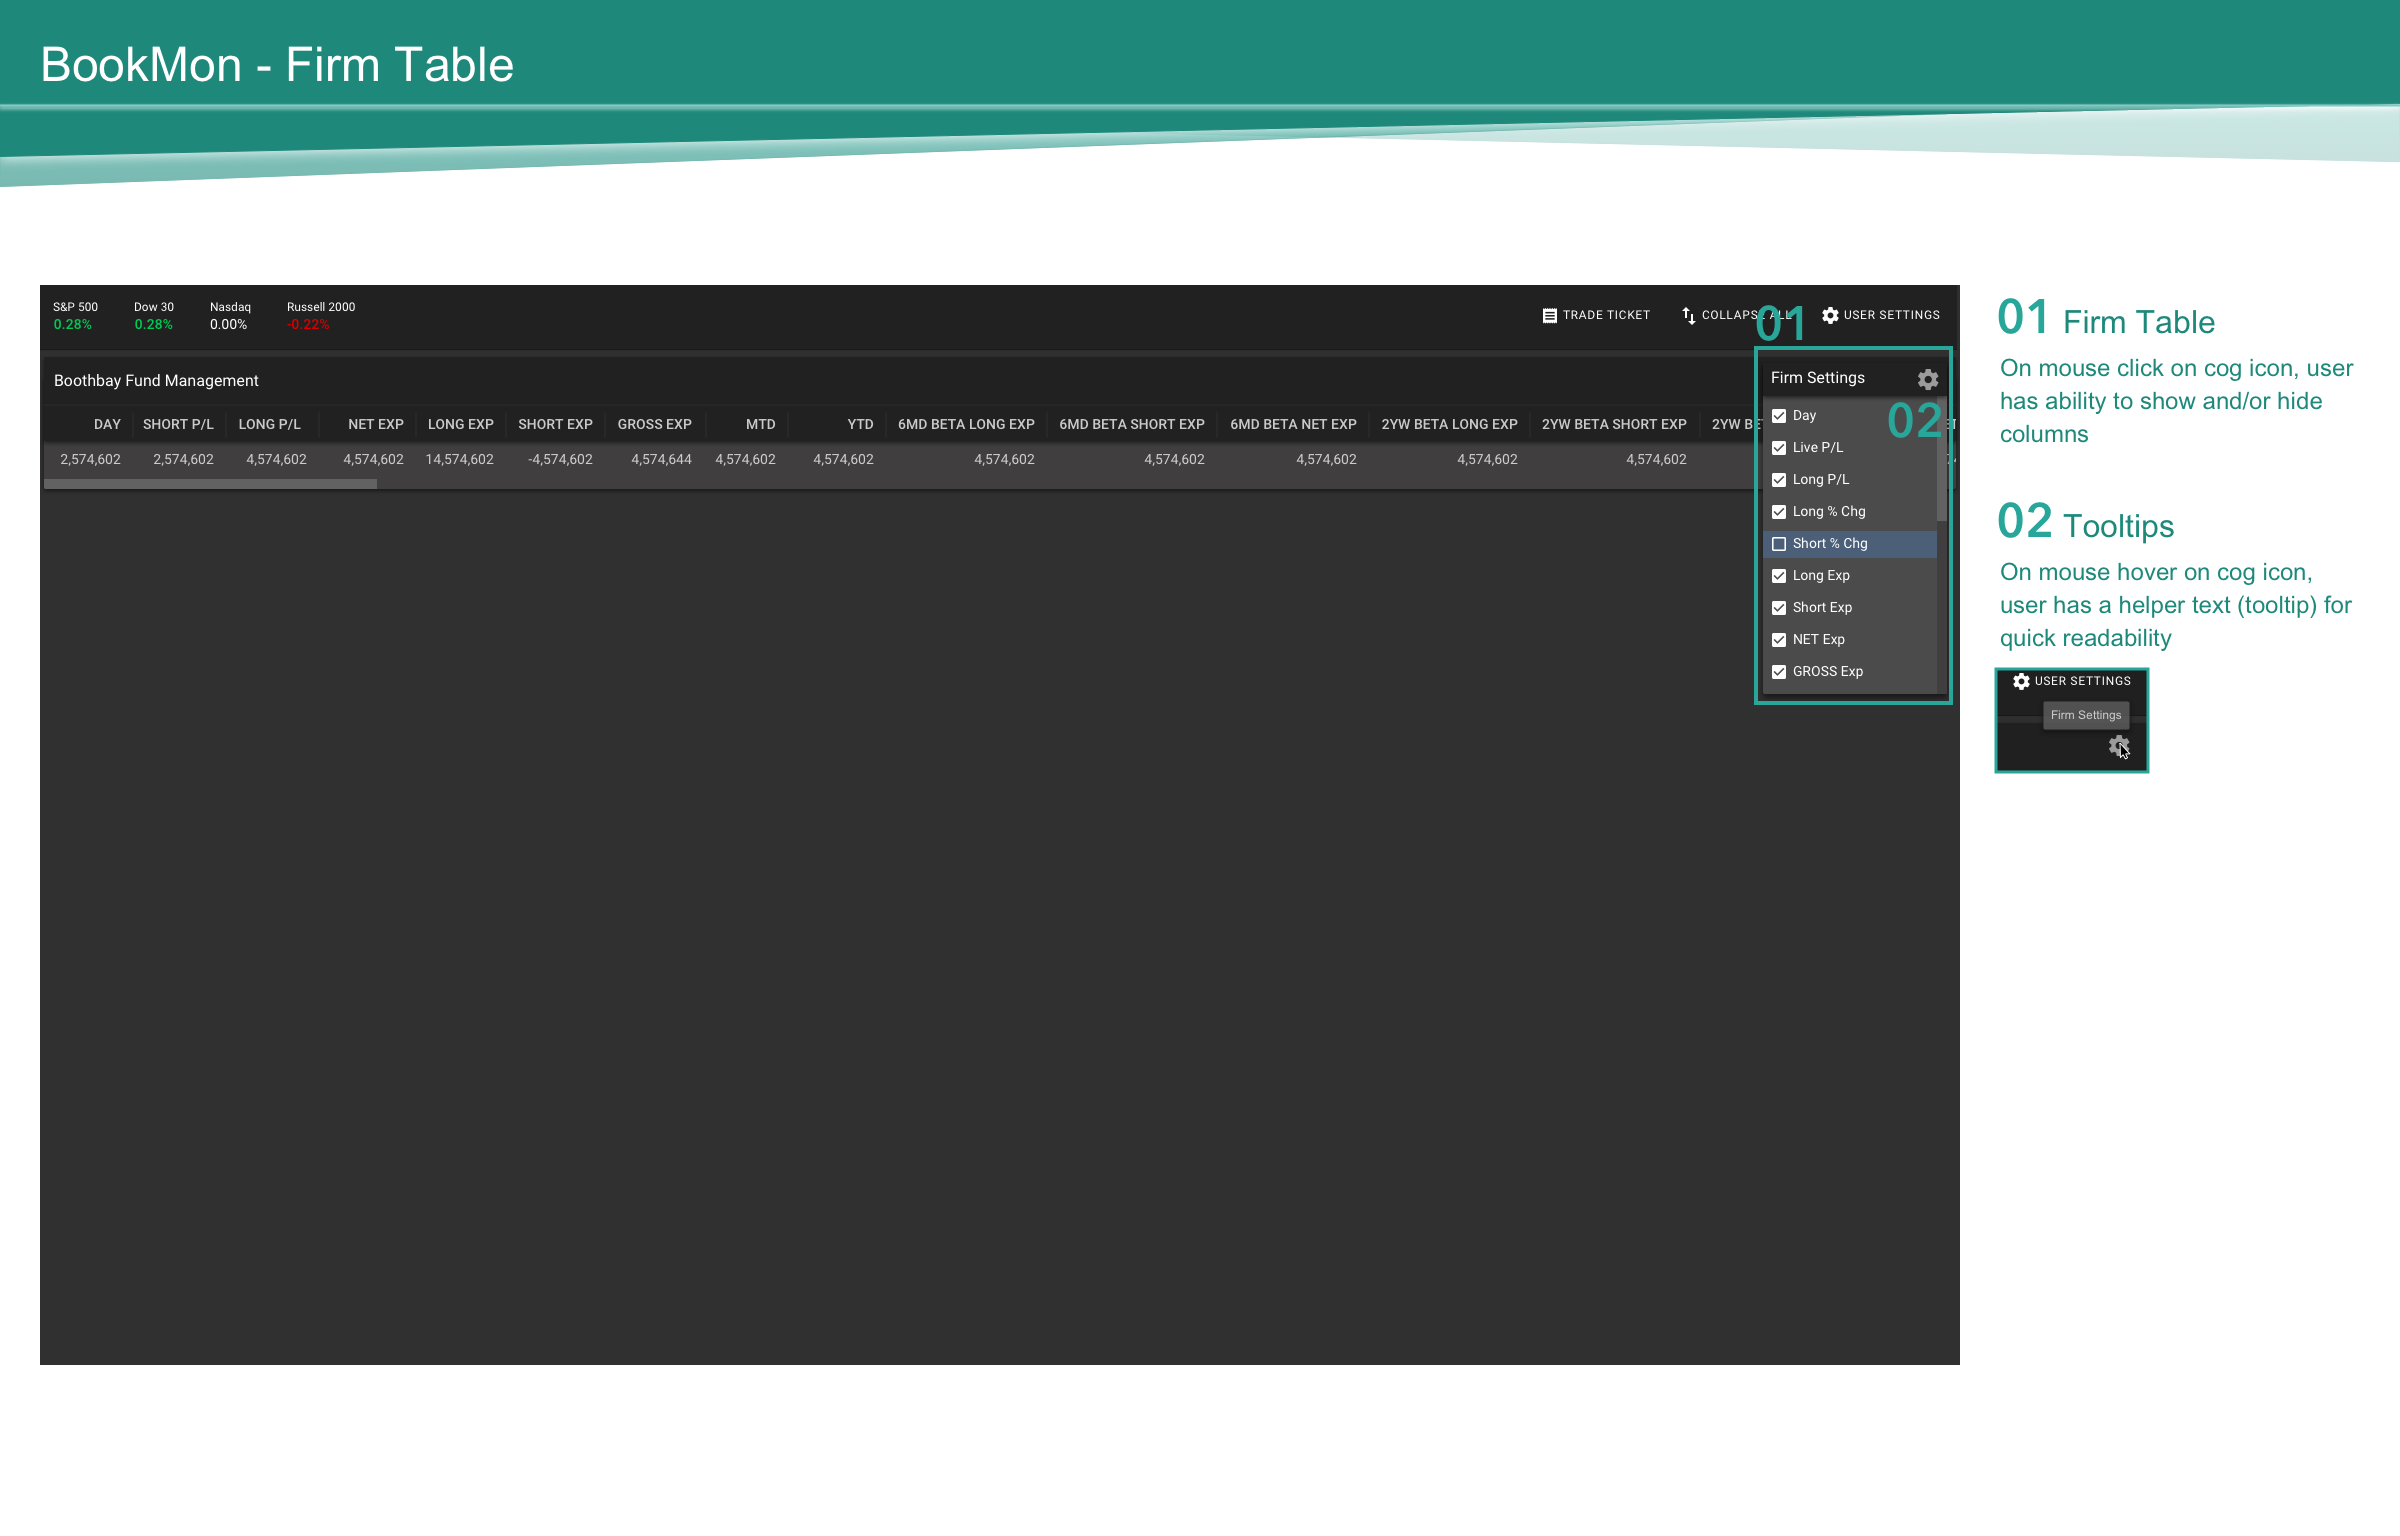
- Show firm-level view for management
- Provide table capabilities for funds and strategies
- Incorporate trade ticket into BookMon tables
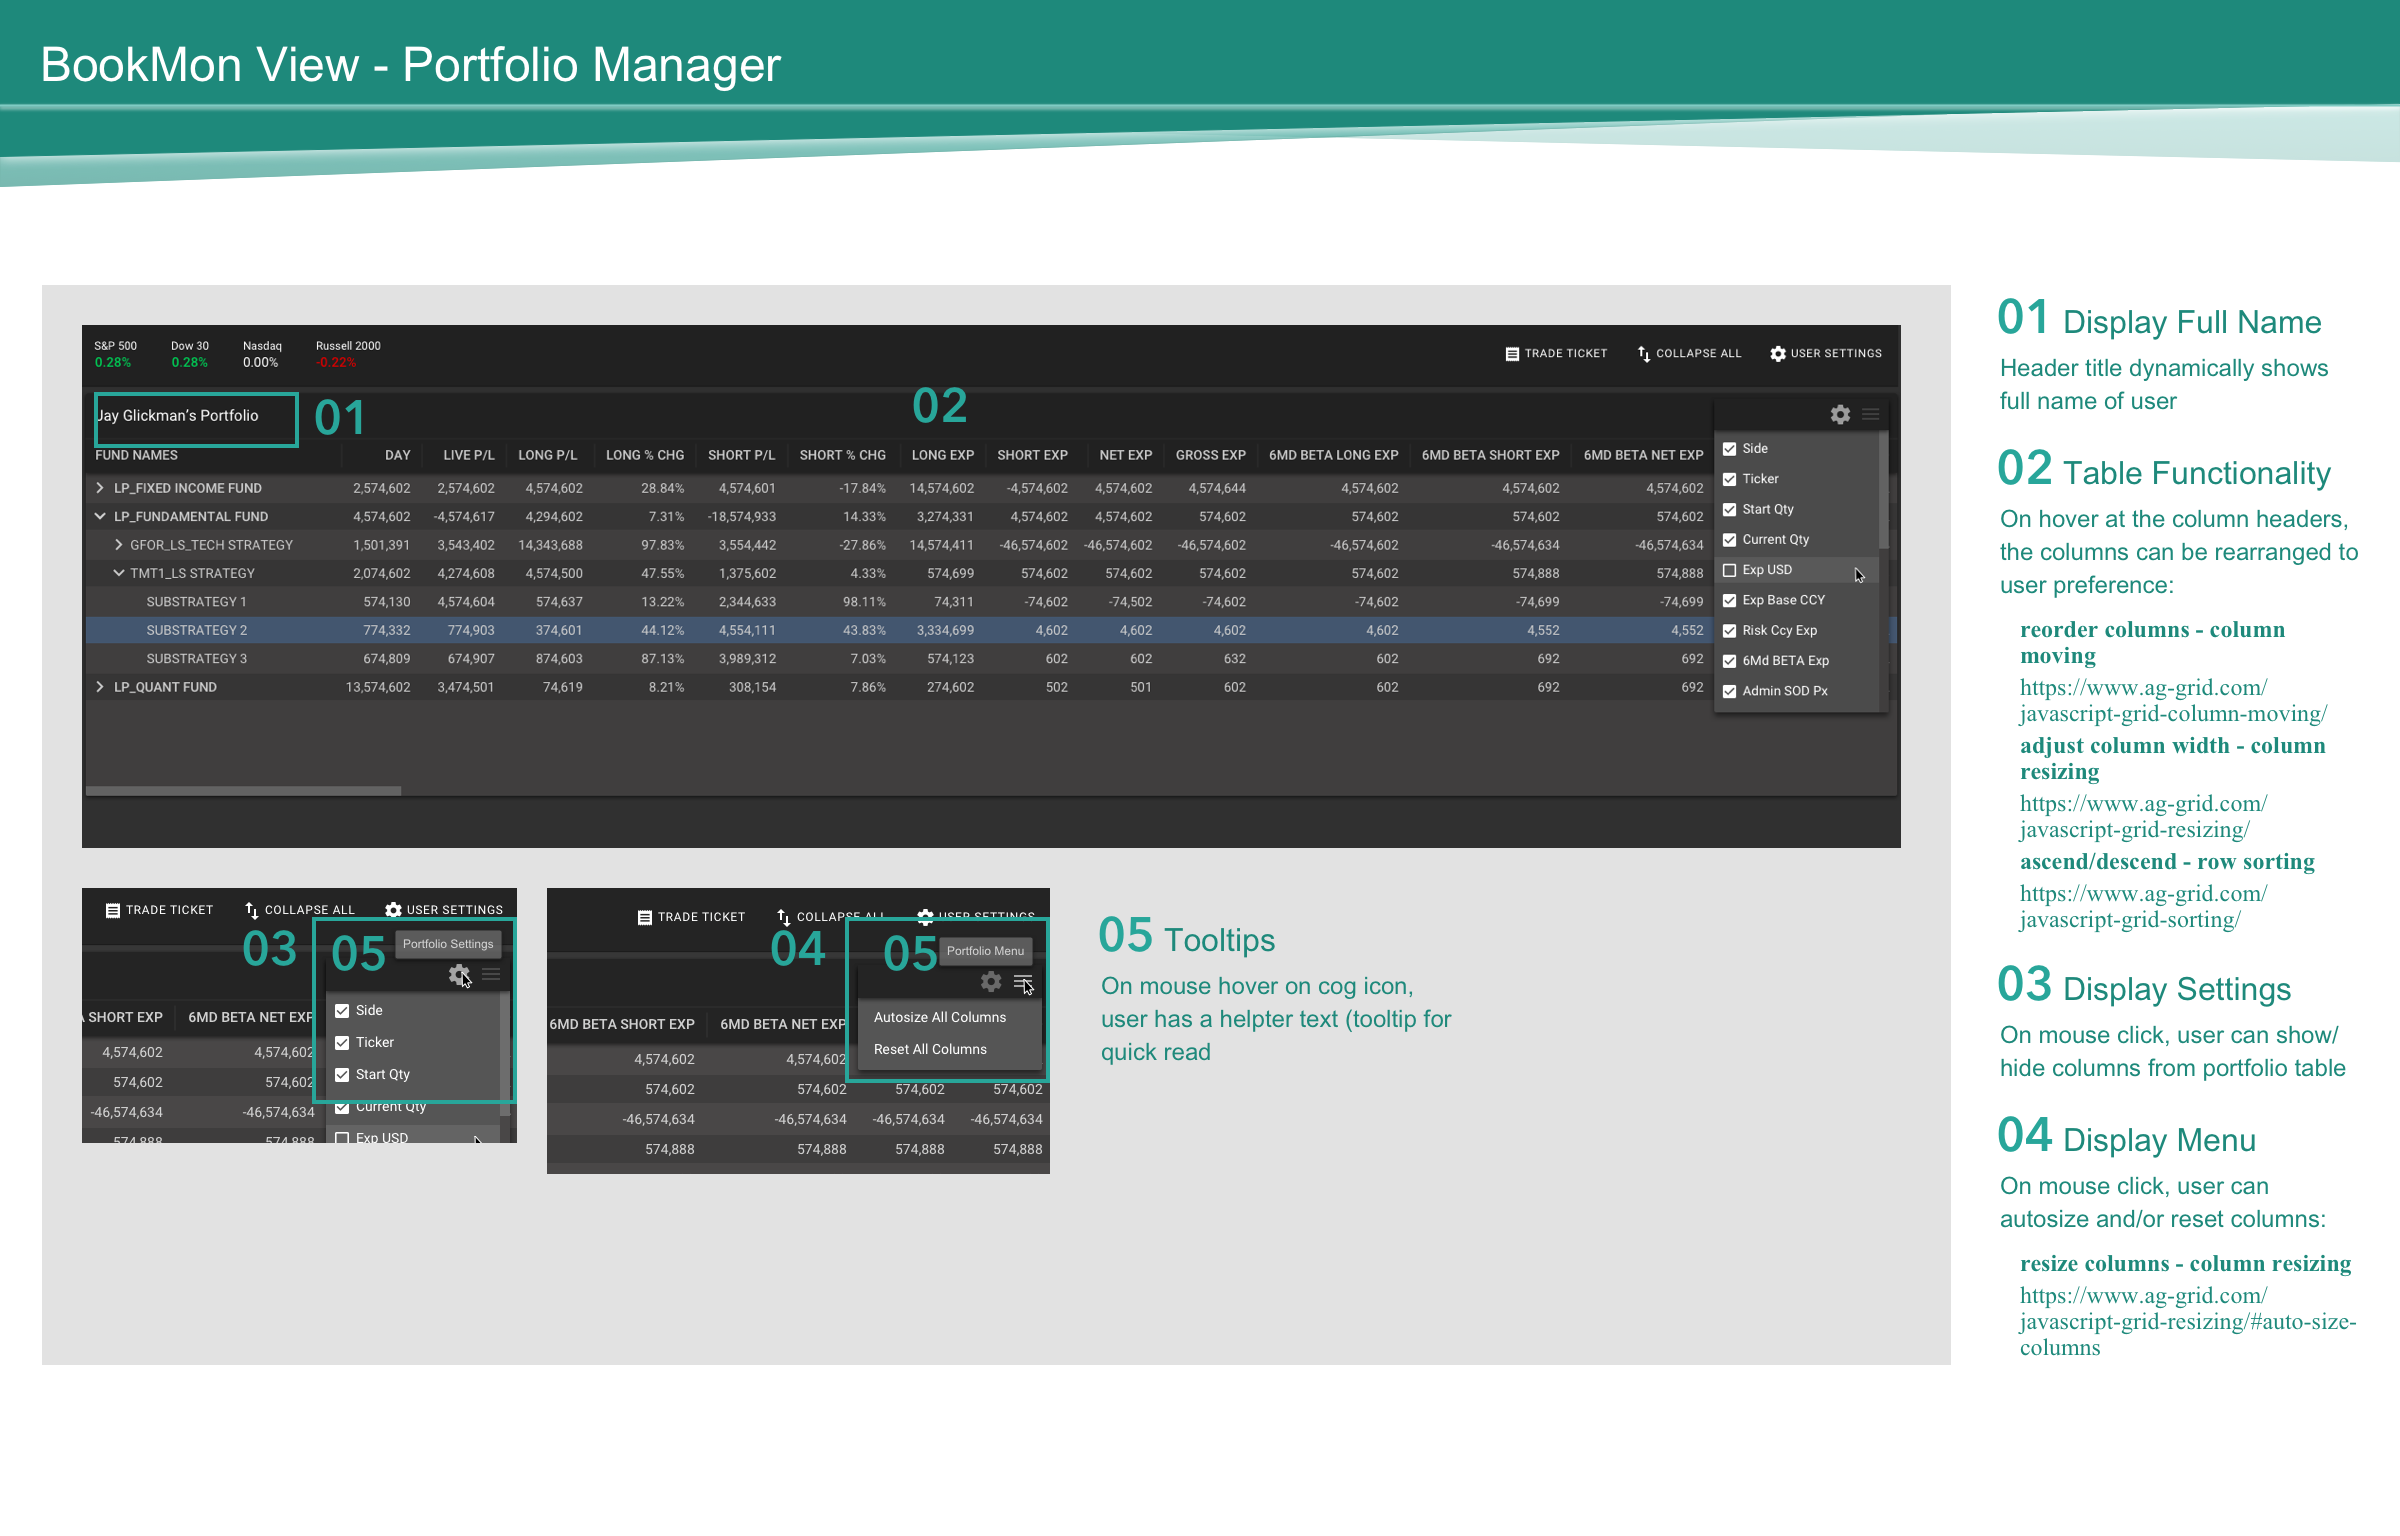
- Manipulate tables by the following user actions:
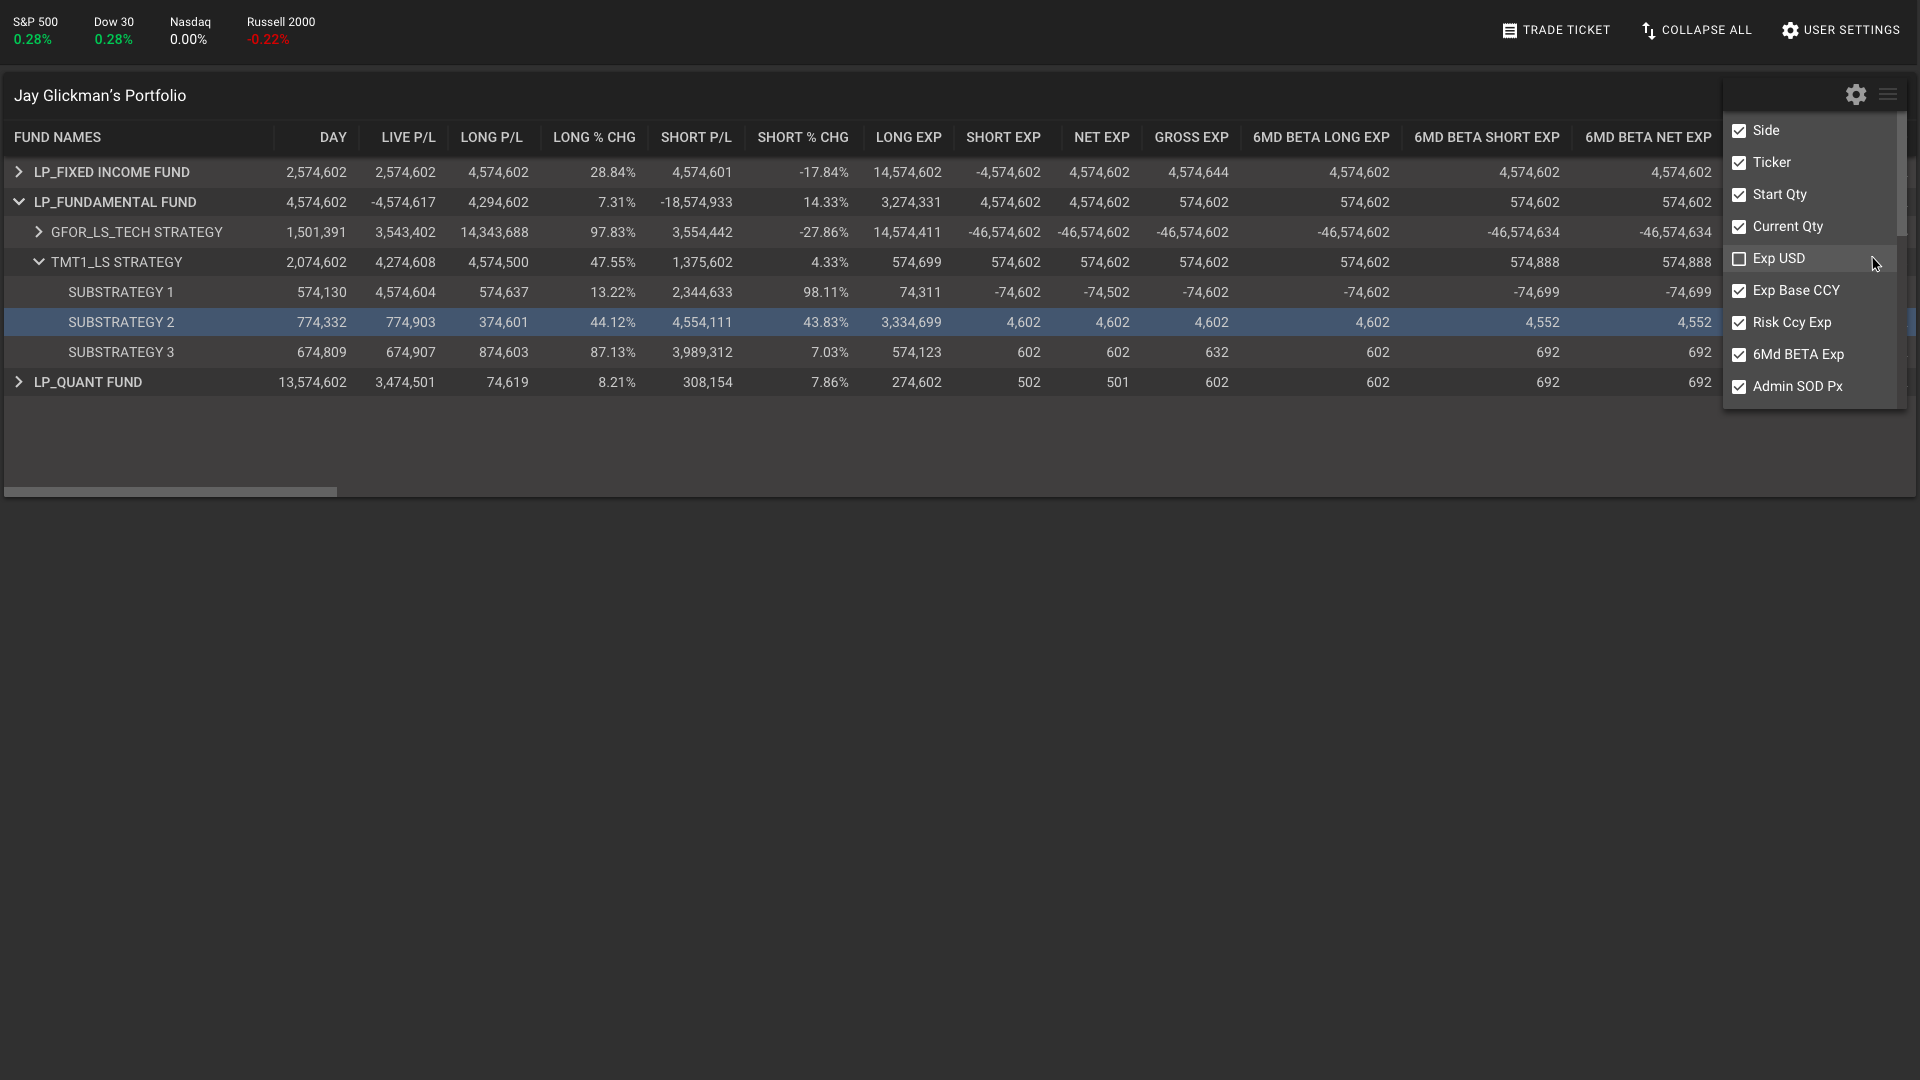
- Show/hide data columns
- Rearrange data columns
- Self-adjust or auto-size data columns
- Sort data columns by ascend/descend
- Filter data columns by ticker or numbers (ie. amount)
- Reset one or all columns
Exploratory Research
demos and user research
Throughout the research phase, I was in constant communication with a business analyst at LightPoint, who was formerly a portfolio manager. He gave us a walk through of BookMon, demonstrating key workflows of a portfolio manager. And highlighted pains that users most often came across when using the application. Some of the needs and pain points that were captured:
needs
- Primary user needs to easily export strategies and positions to excel spreadsheets
- Primary user needs to view positions of any n-level strategies
- Primary user needs to see only their funds that they monitor on daily basis
- Secondary user needs to see overall view of hedge fund performance
- Both users need to filter positions based on P&L, location, and other factors:
- Both users need to manipulate tables by the following actions:
- Show/hide data columns
- Rearrange data columns
- Self-adjust or auto-size data columns
- Sort data columns by ascend/descend
- Filter data columns by ticker or numbers (ie. amount)
- Reset one or all columns
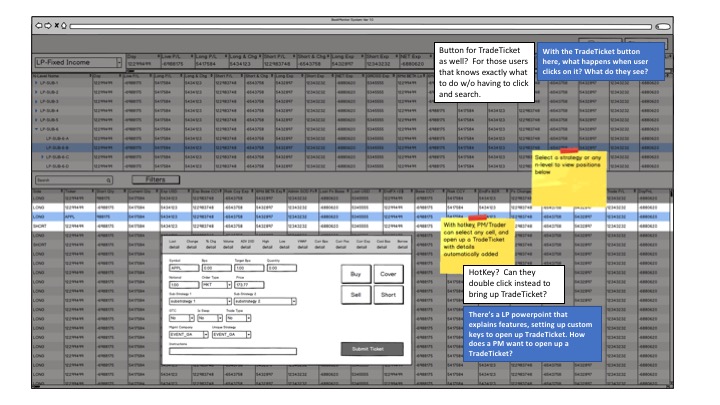
- Both users need to open up trade ticket with position details populated
- Both users need to export strategies and/or positions to excel
pain points
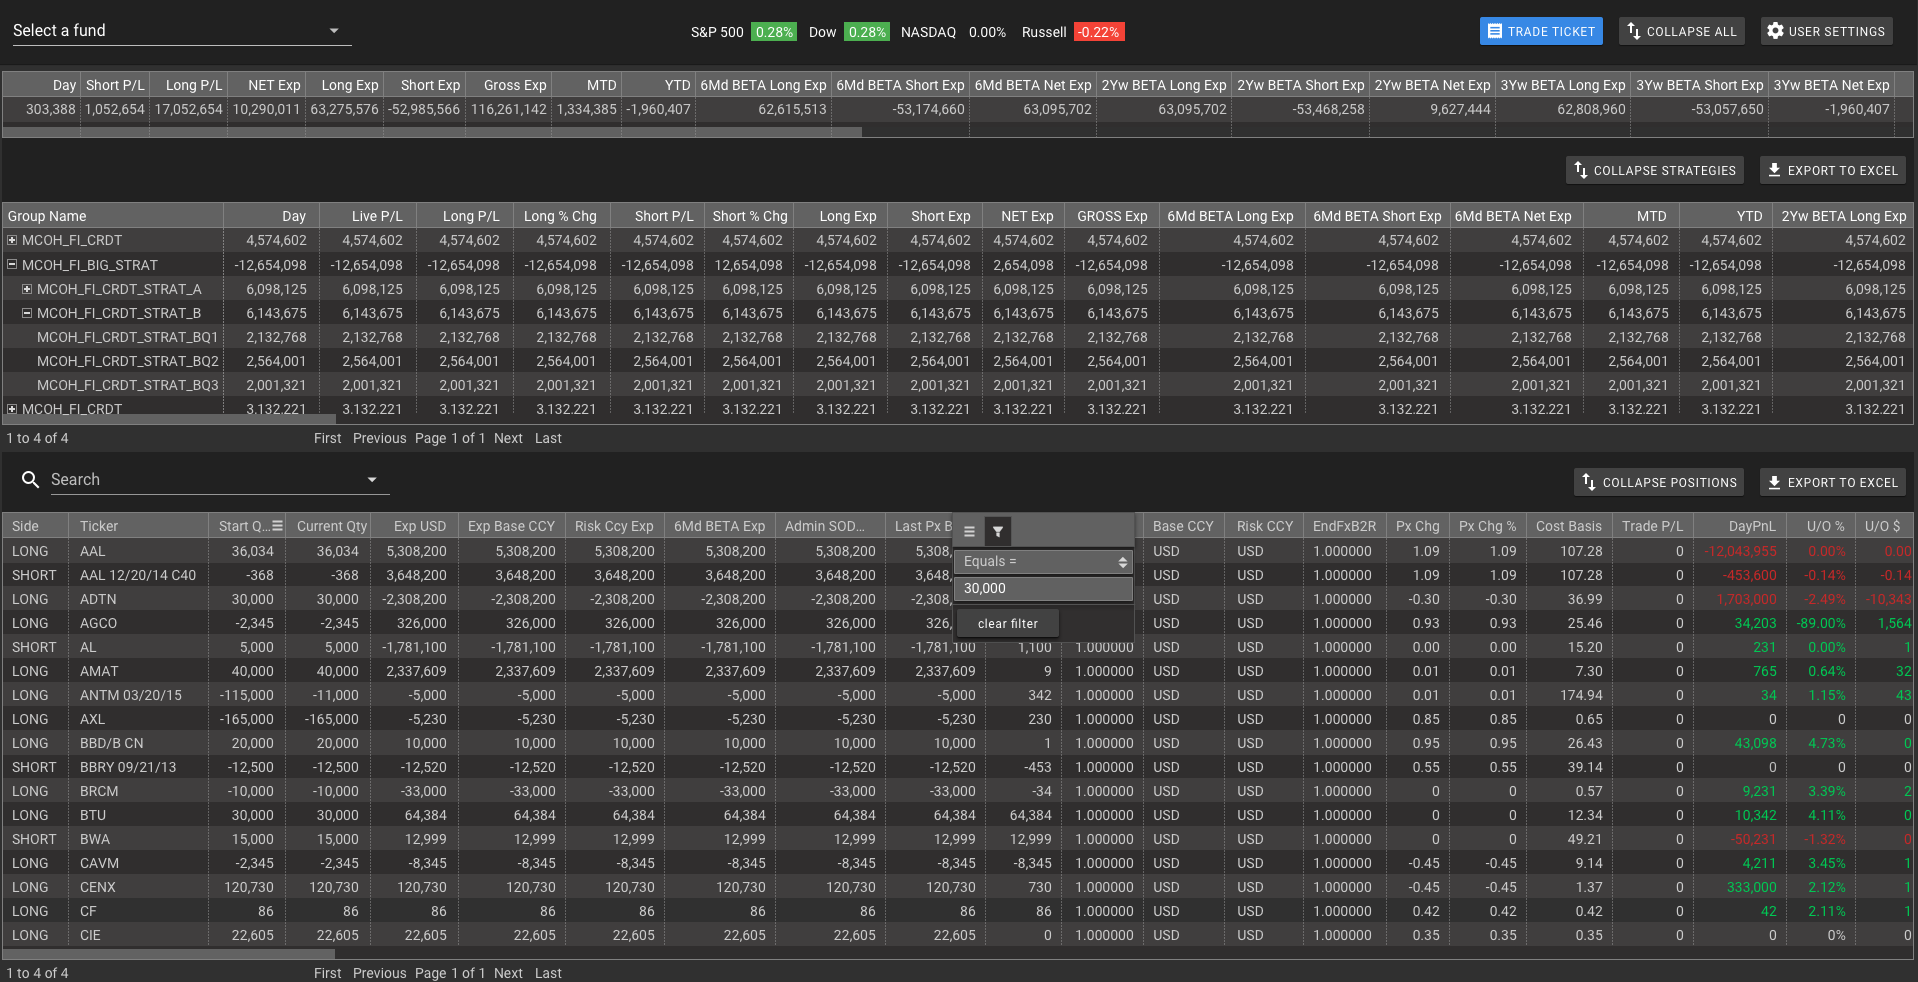
- User wants to change columns after every login because those changes cannot be saved
- User wants flexible search because the current search function requires exact naming and spaces which is error-prone and tedious
- User wants to see position details populated in the TradeTicket dialog, so they don't have to type in the ticker symbol
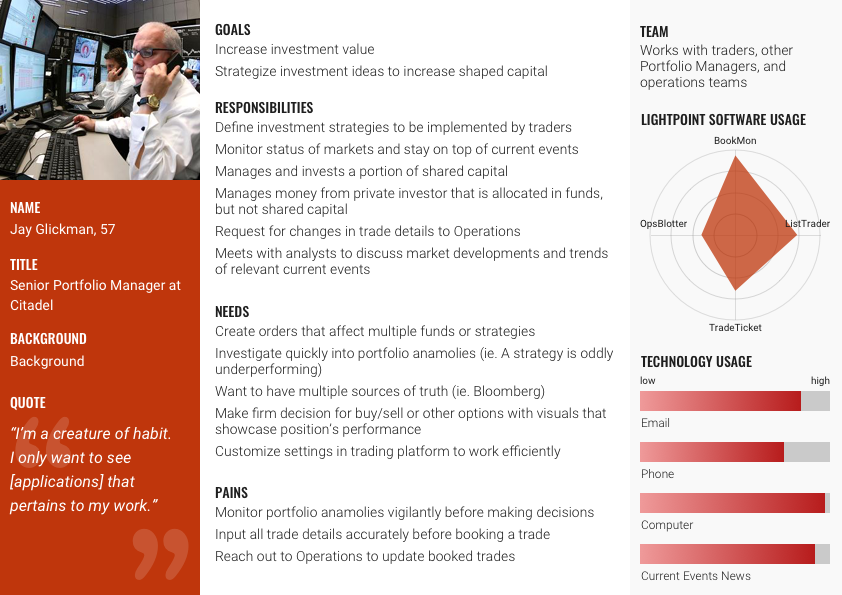
Personas
primary personas
The primary personas are Portfolio Managers and Traders. The former are the "planners", and they strategize actions with Management to achieve their quarterly goals. The latter, traders are "executioners", they take the strategies created by PMs and execute trades. These two personas heavily use BookMon, as they monitor their portfolios and make day trades.
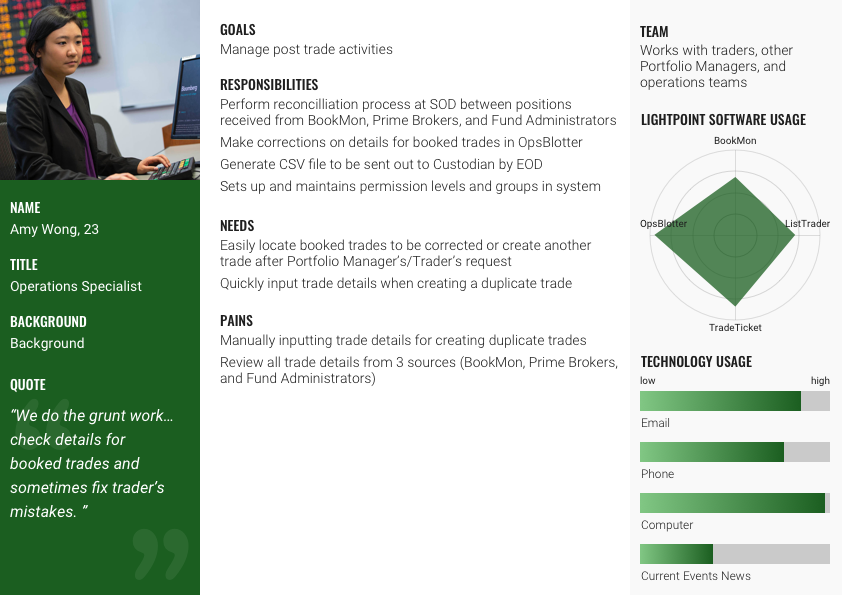
secondary personas
The secondary persona is Management. They oversee portfolio managers and traders, and want to see the overall company performance as well as individual performances of their employees. The Management doesn't frequently use BookMon as much as the primary personas, but they do use it to monitor the company funds.
tertiary personas
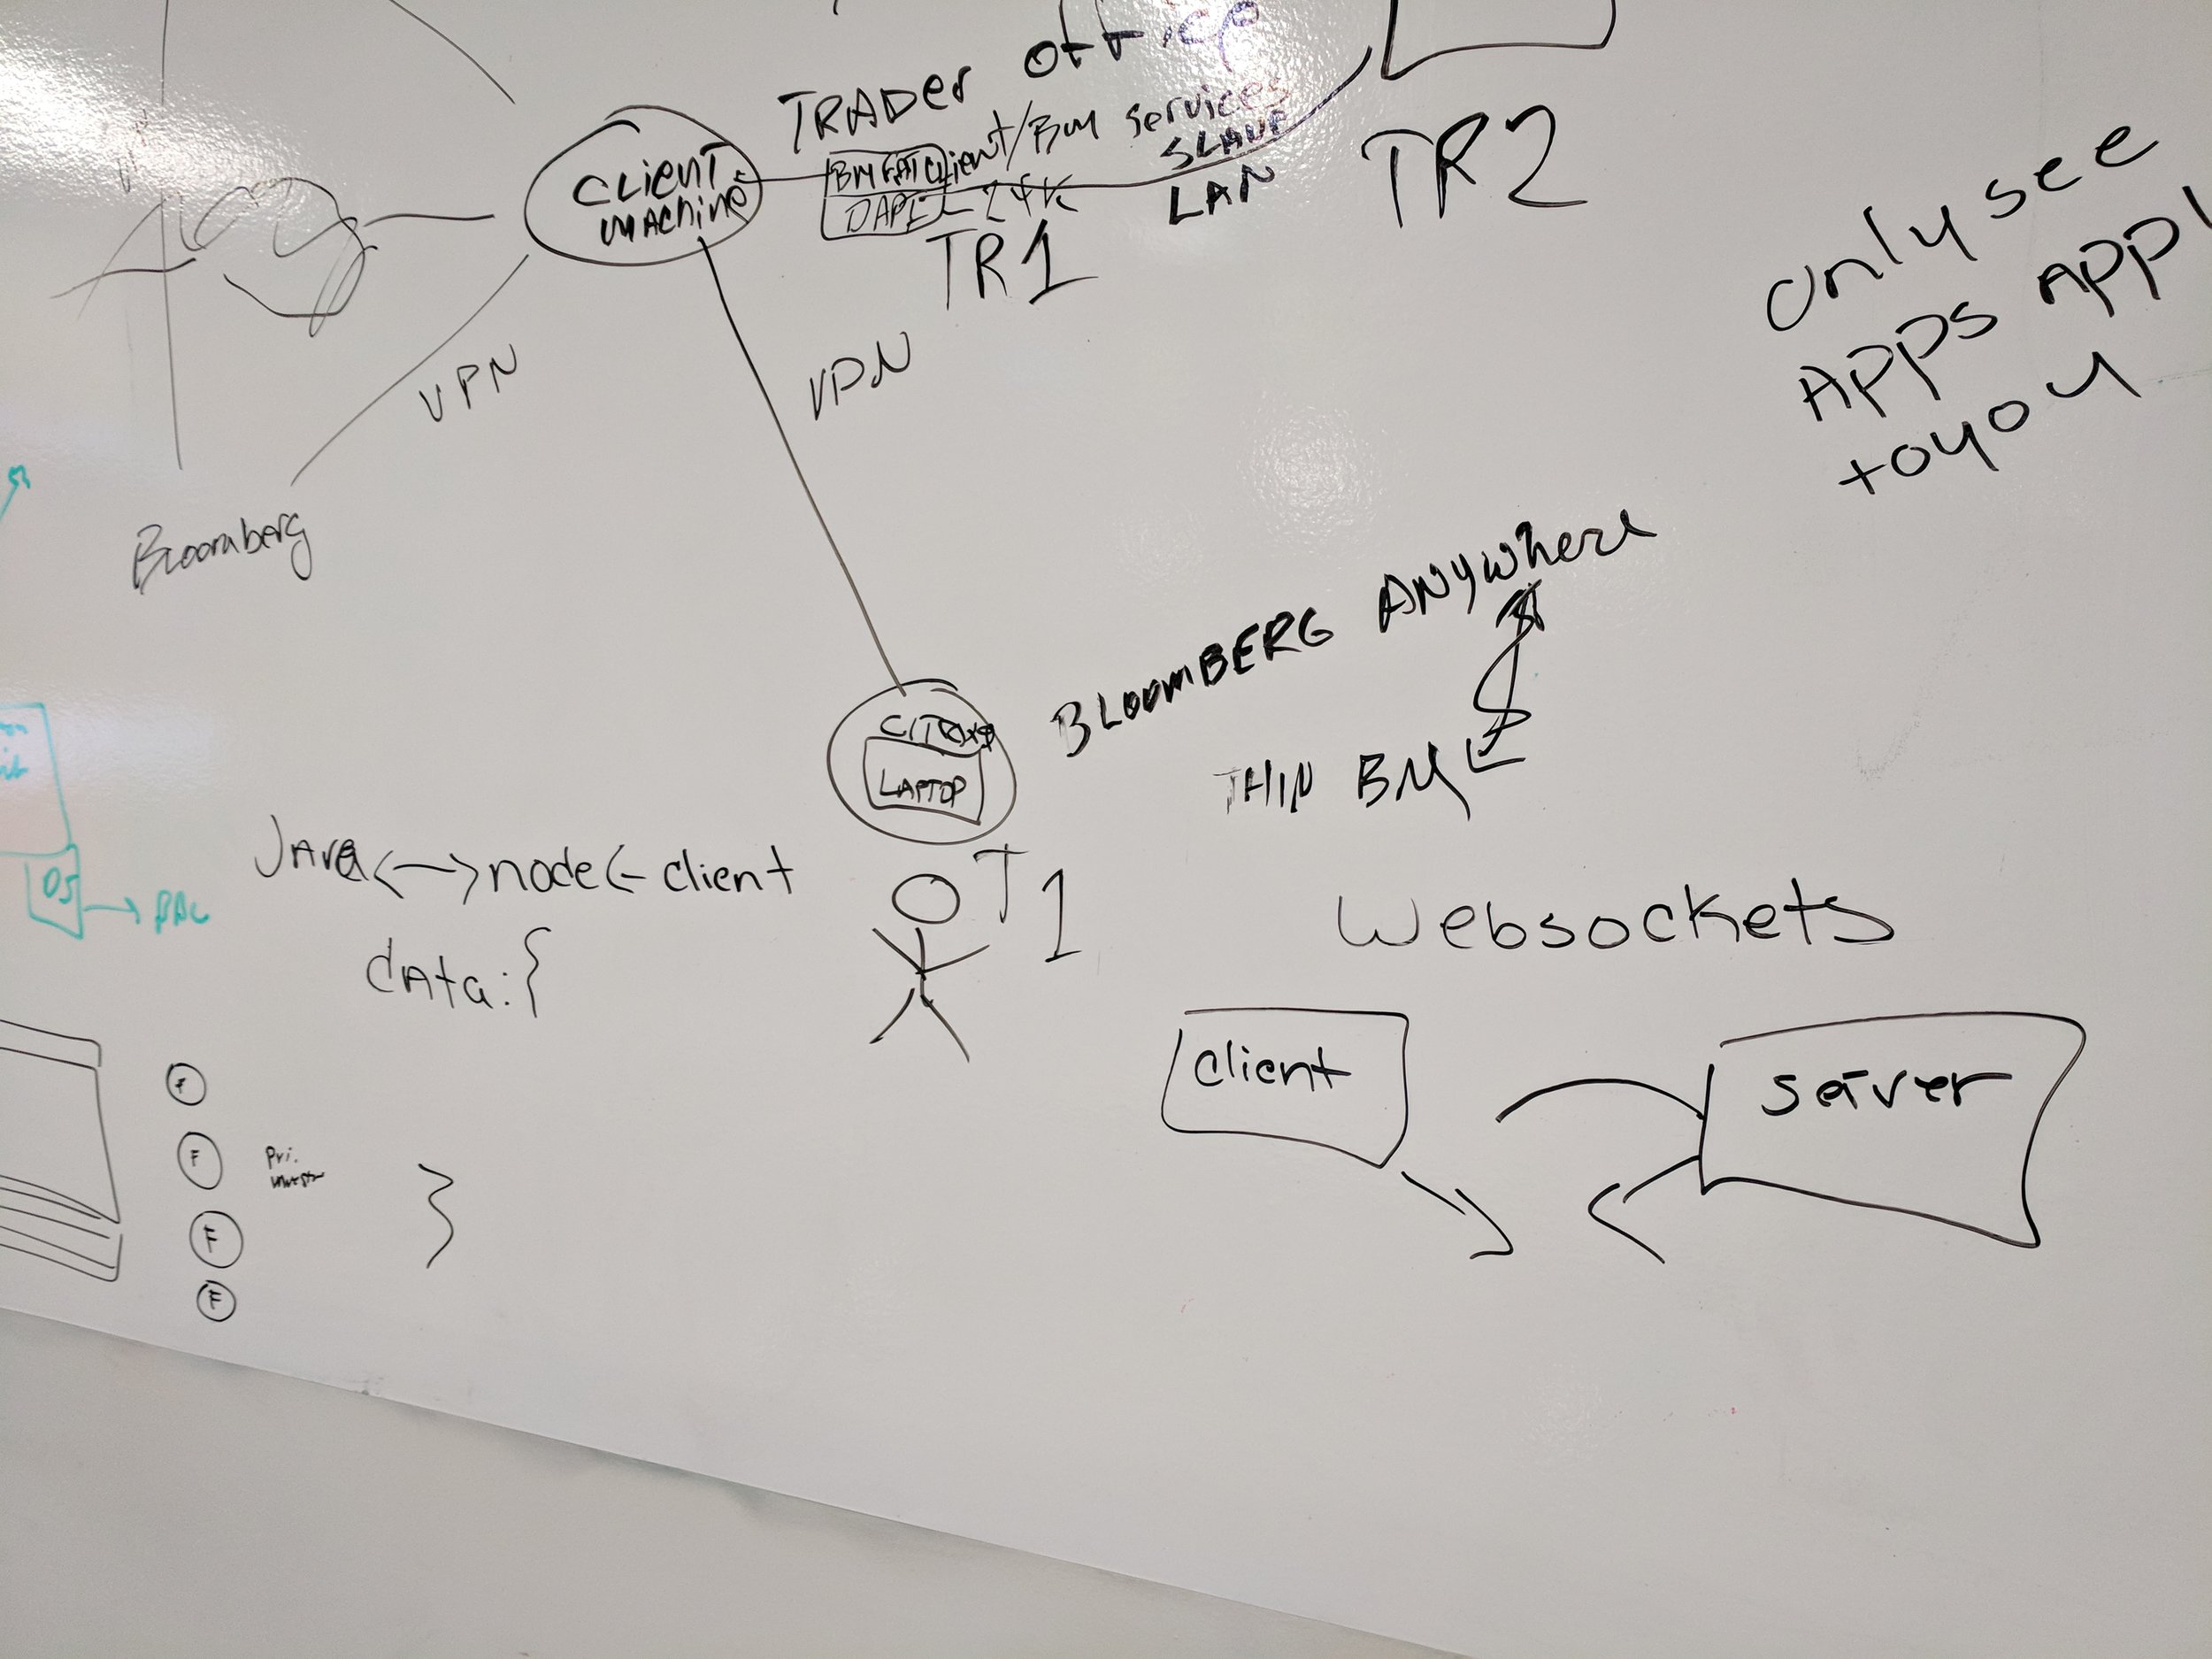
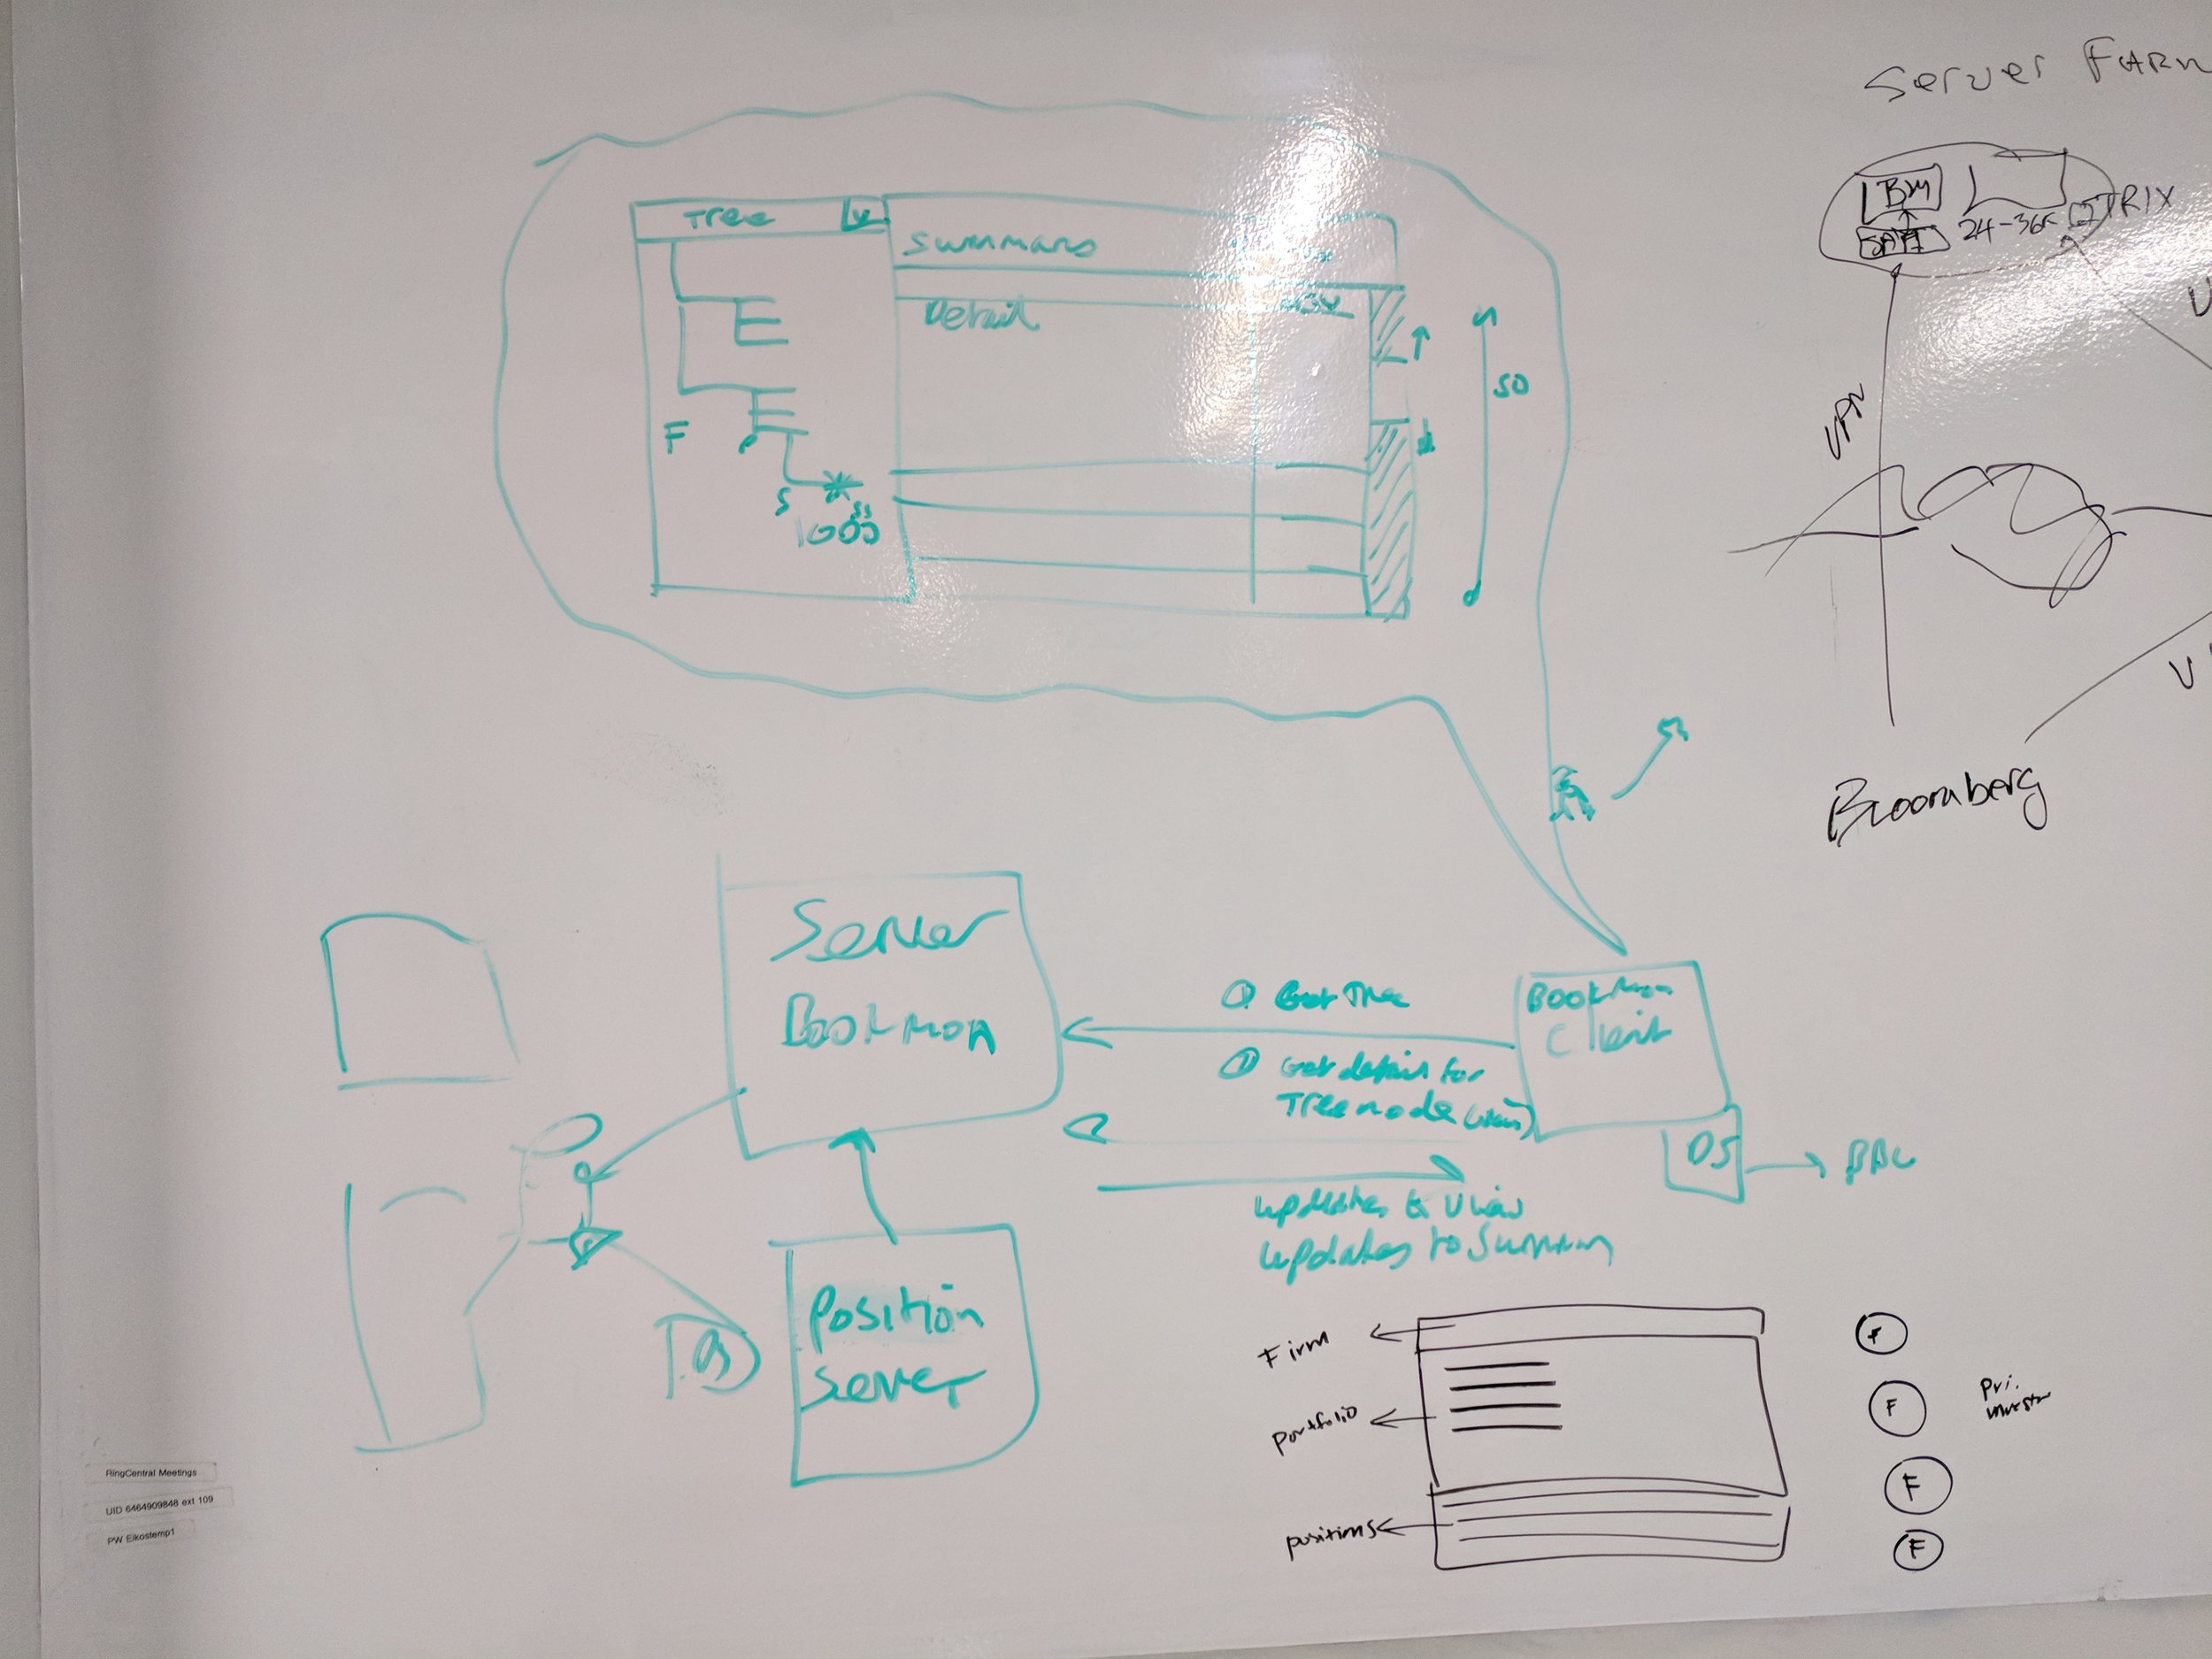
The tertiary persona are Dev Ops specialists. In a typical workflow of making a succesful trade, the trader makes a decision to buy or sell a position. That trade undergoes another workflow where it goes through DevOps for quality check, checked by compliance, and gets sent to Bloomberg EMSX.

Experience Map
mapping the bookmon and tradeticket experience
I mapped the PM (and/or trader) experience in monitoring their portfolio and completing an order. The entire experience is mapped to include their thoughts, feelings, and behaviors. Most often PMs/traders felt pains when drilling into strategies to find underperforming positions. The current interface requires "double clicks" to drill into n-levels, and cross-reference with other resources (ie. Bloomberg) to confirm position details. Another common pain, is that the trade ticket is a separate application that must be launched before submitting an order. This delay in execution could cost PMs/traders on profits and opportunities.
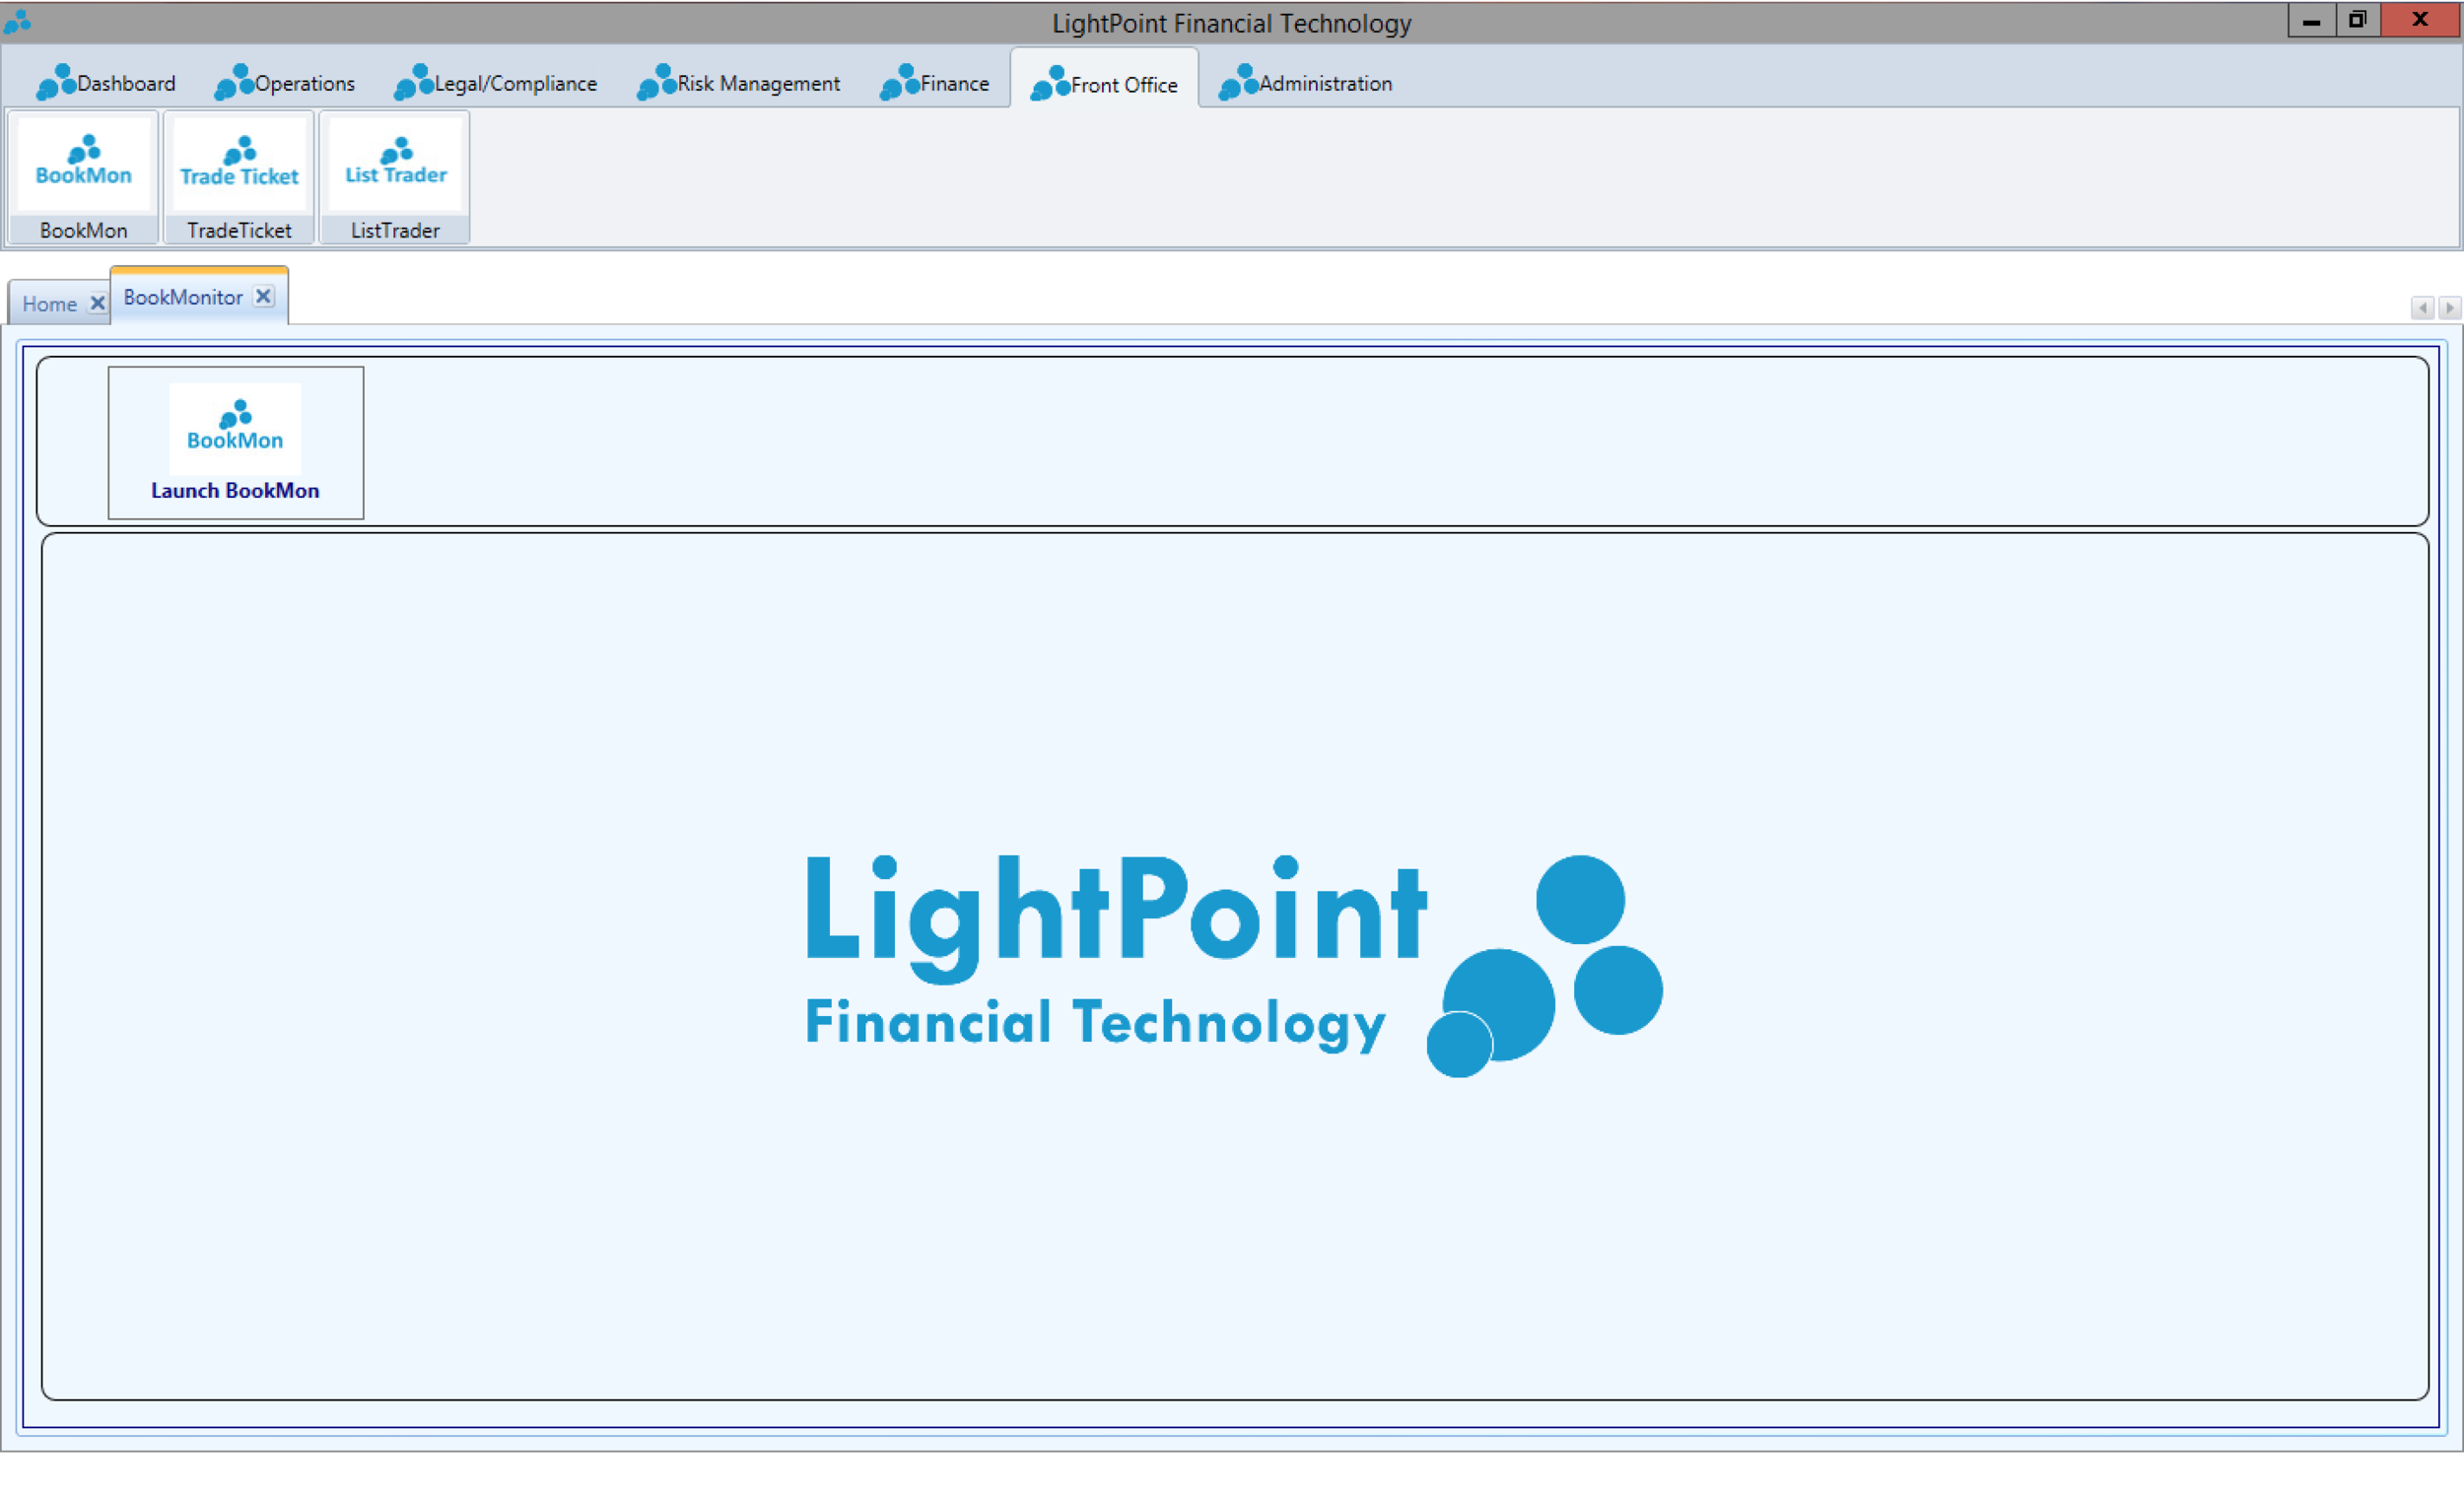
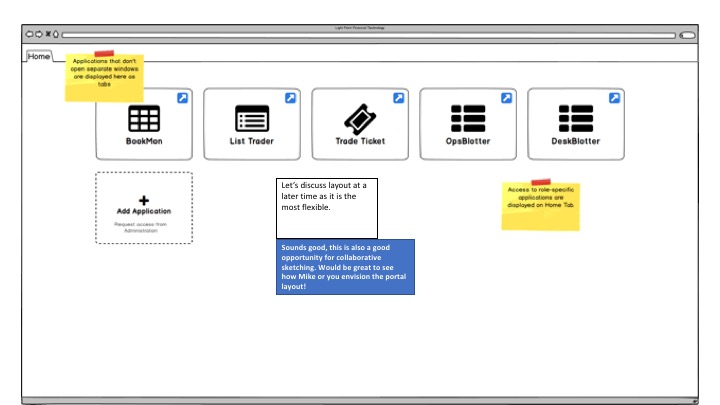
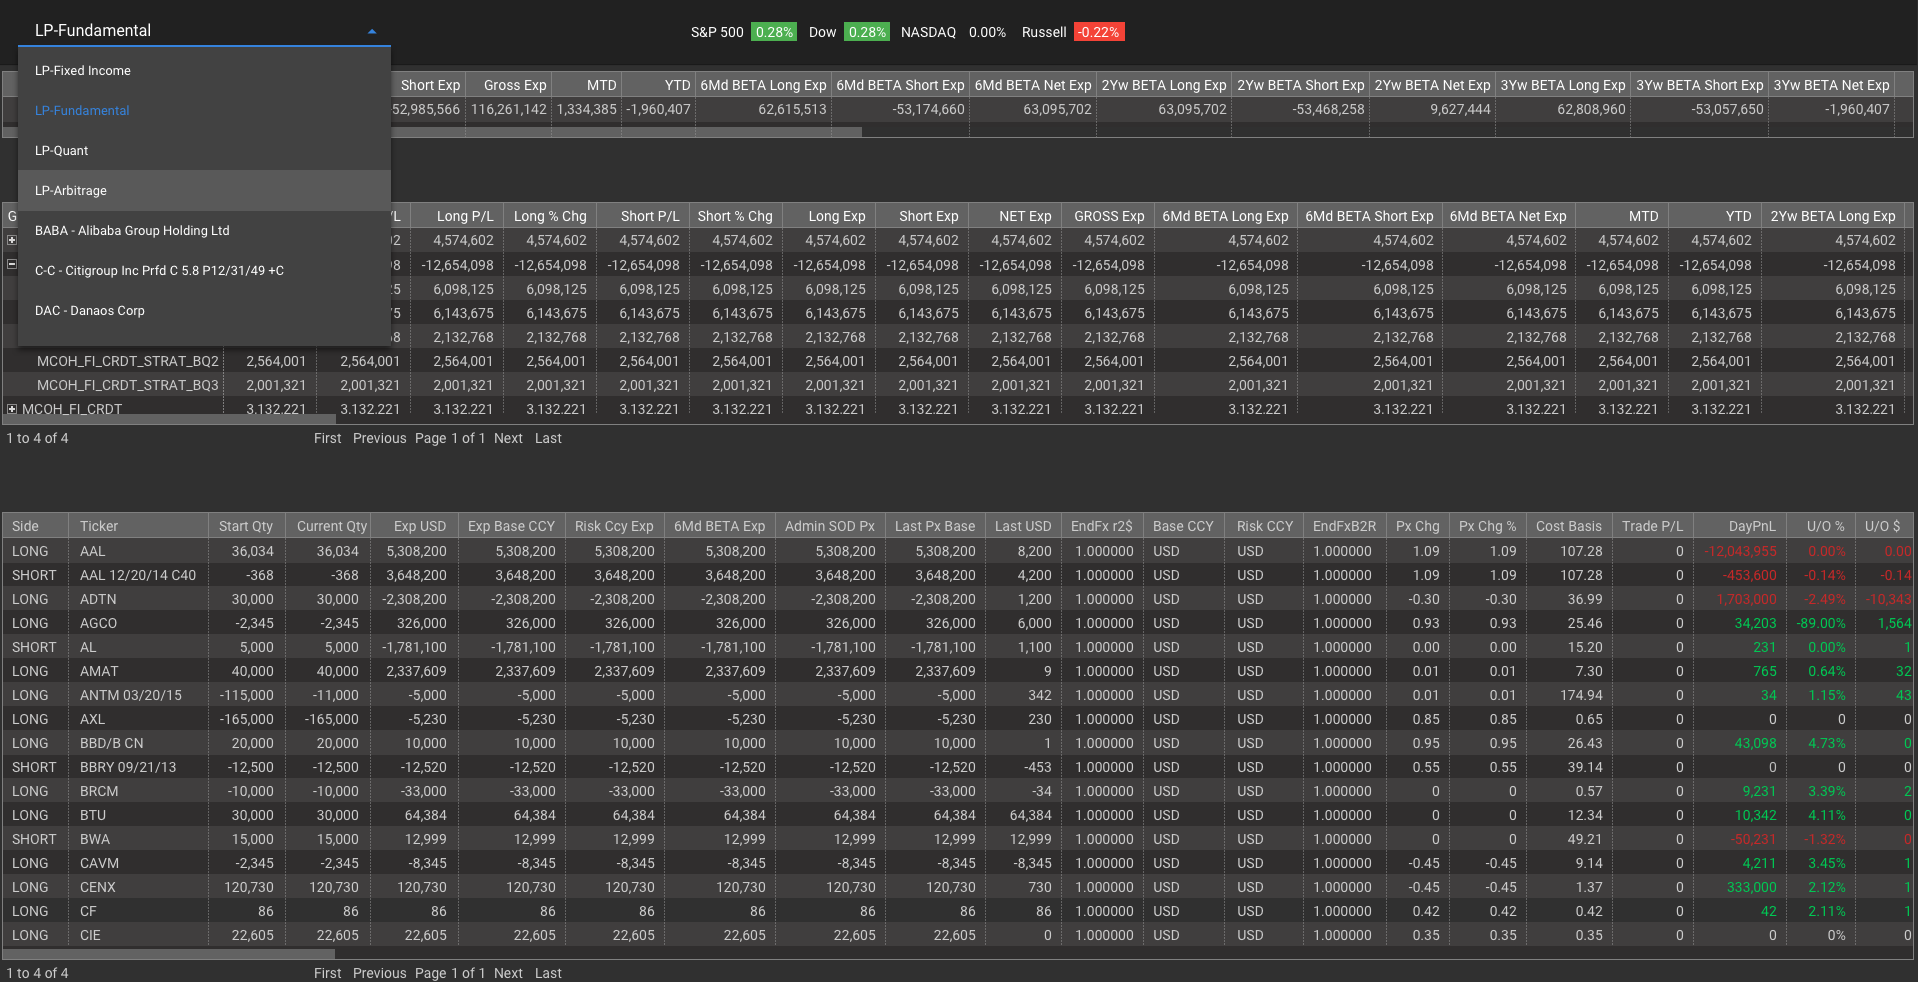
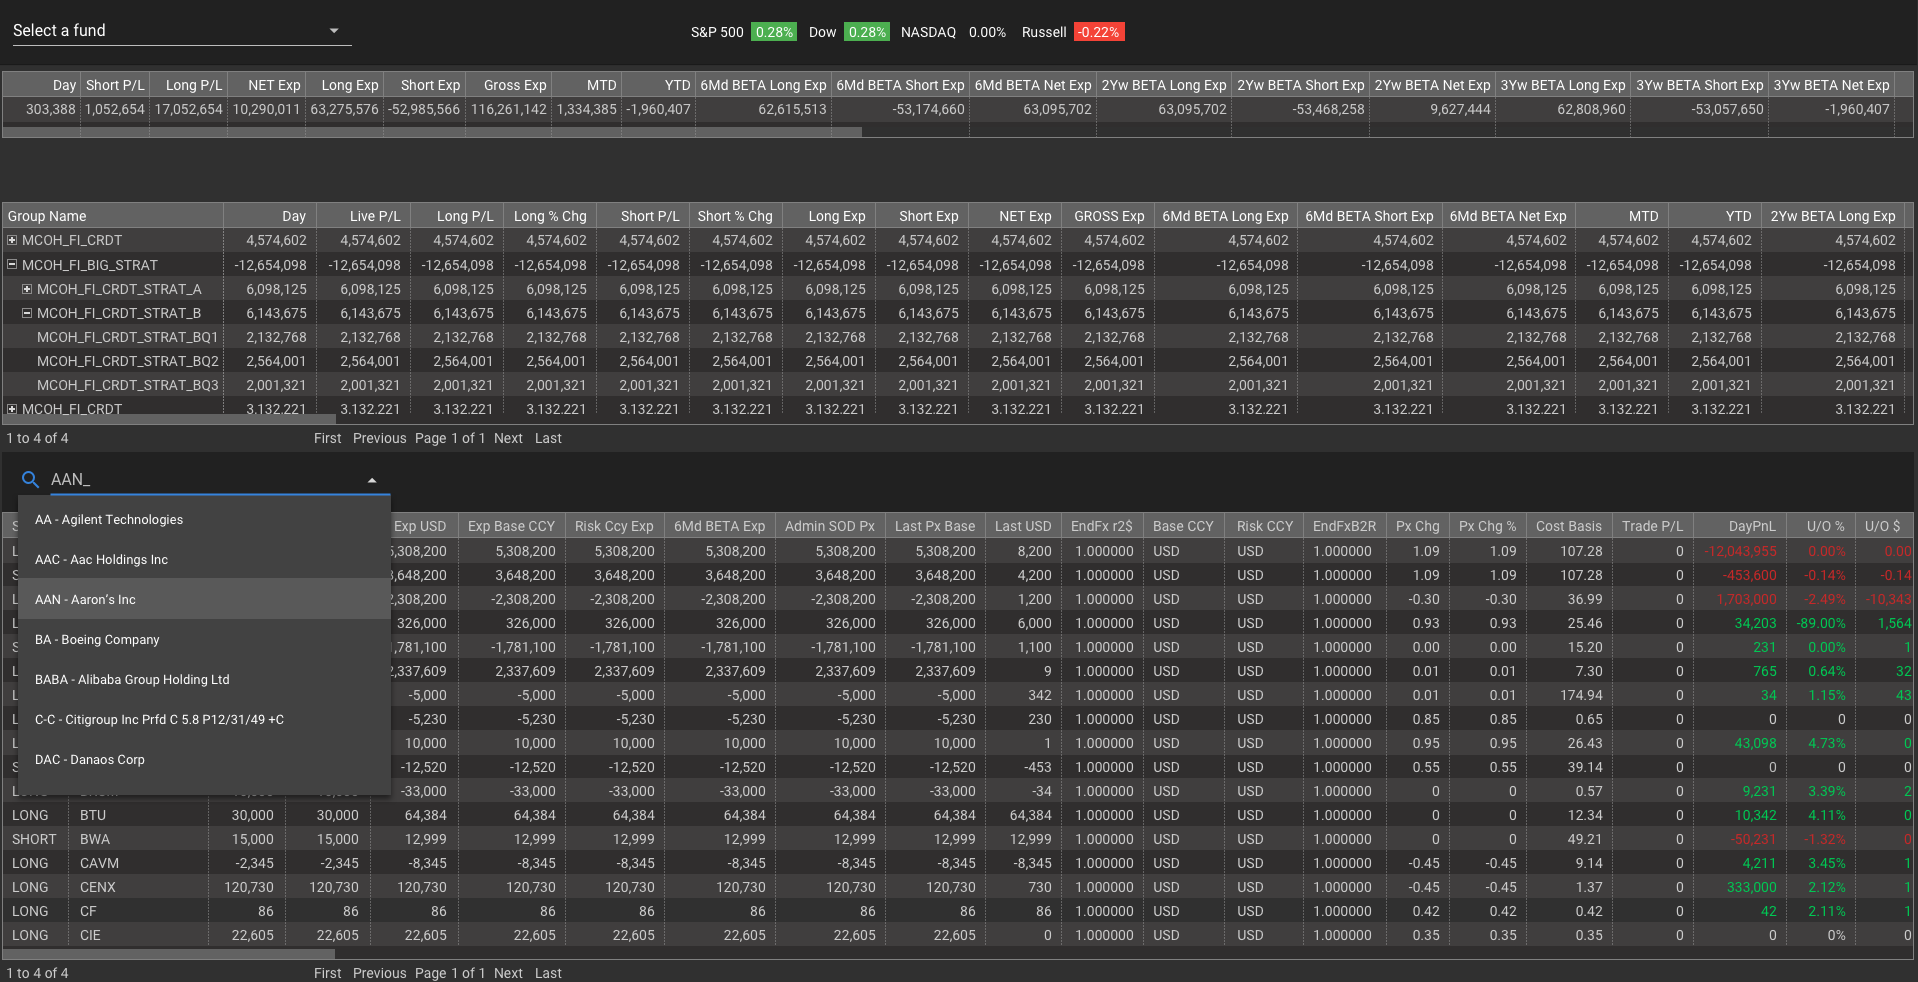
Current BookMon and Portal
I was given a demo of the current applications.


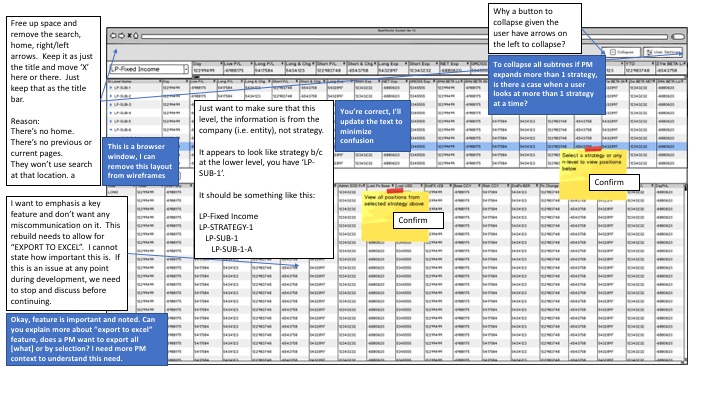
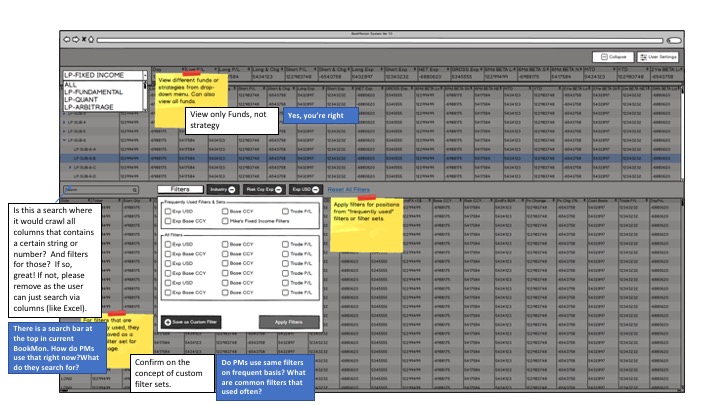
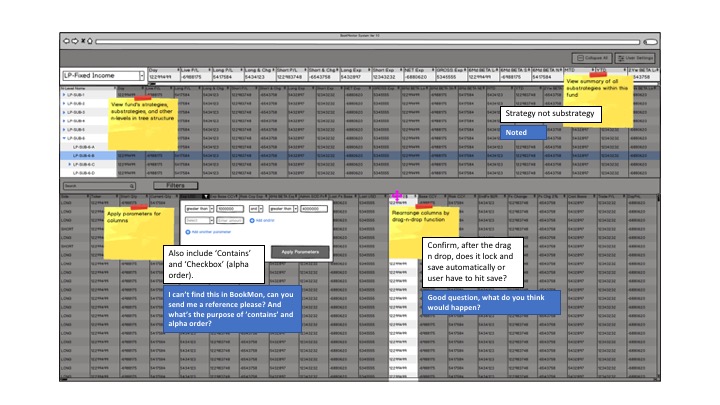
Wireframes
After mapping PM/trader experience in managing their books, I drafted 2 iterations of wireframes. I received validations from a LightPoint business analyst; his comments are in the white text areas. Mine are in blue.

User Stories
With enough context, I defined the user tasks and translated them into user stories. These user stories enabled me to focus on UI design to optimize space for position rows and table functionalities such as sorting, filtering, and grouping.

Brainstorming
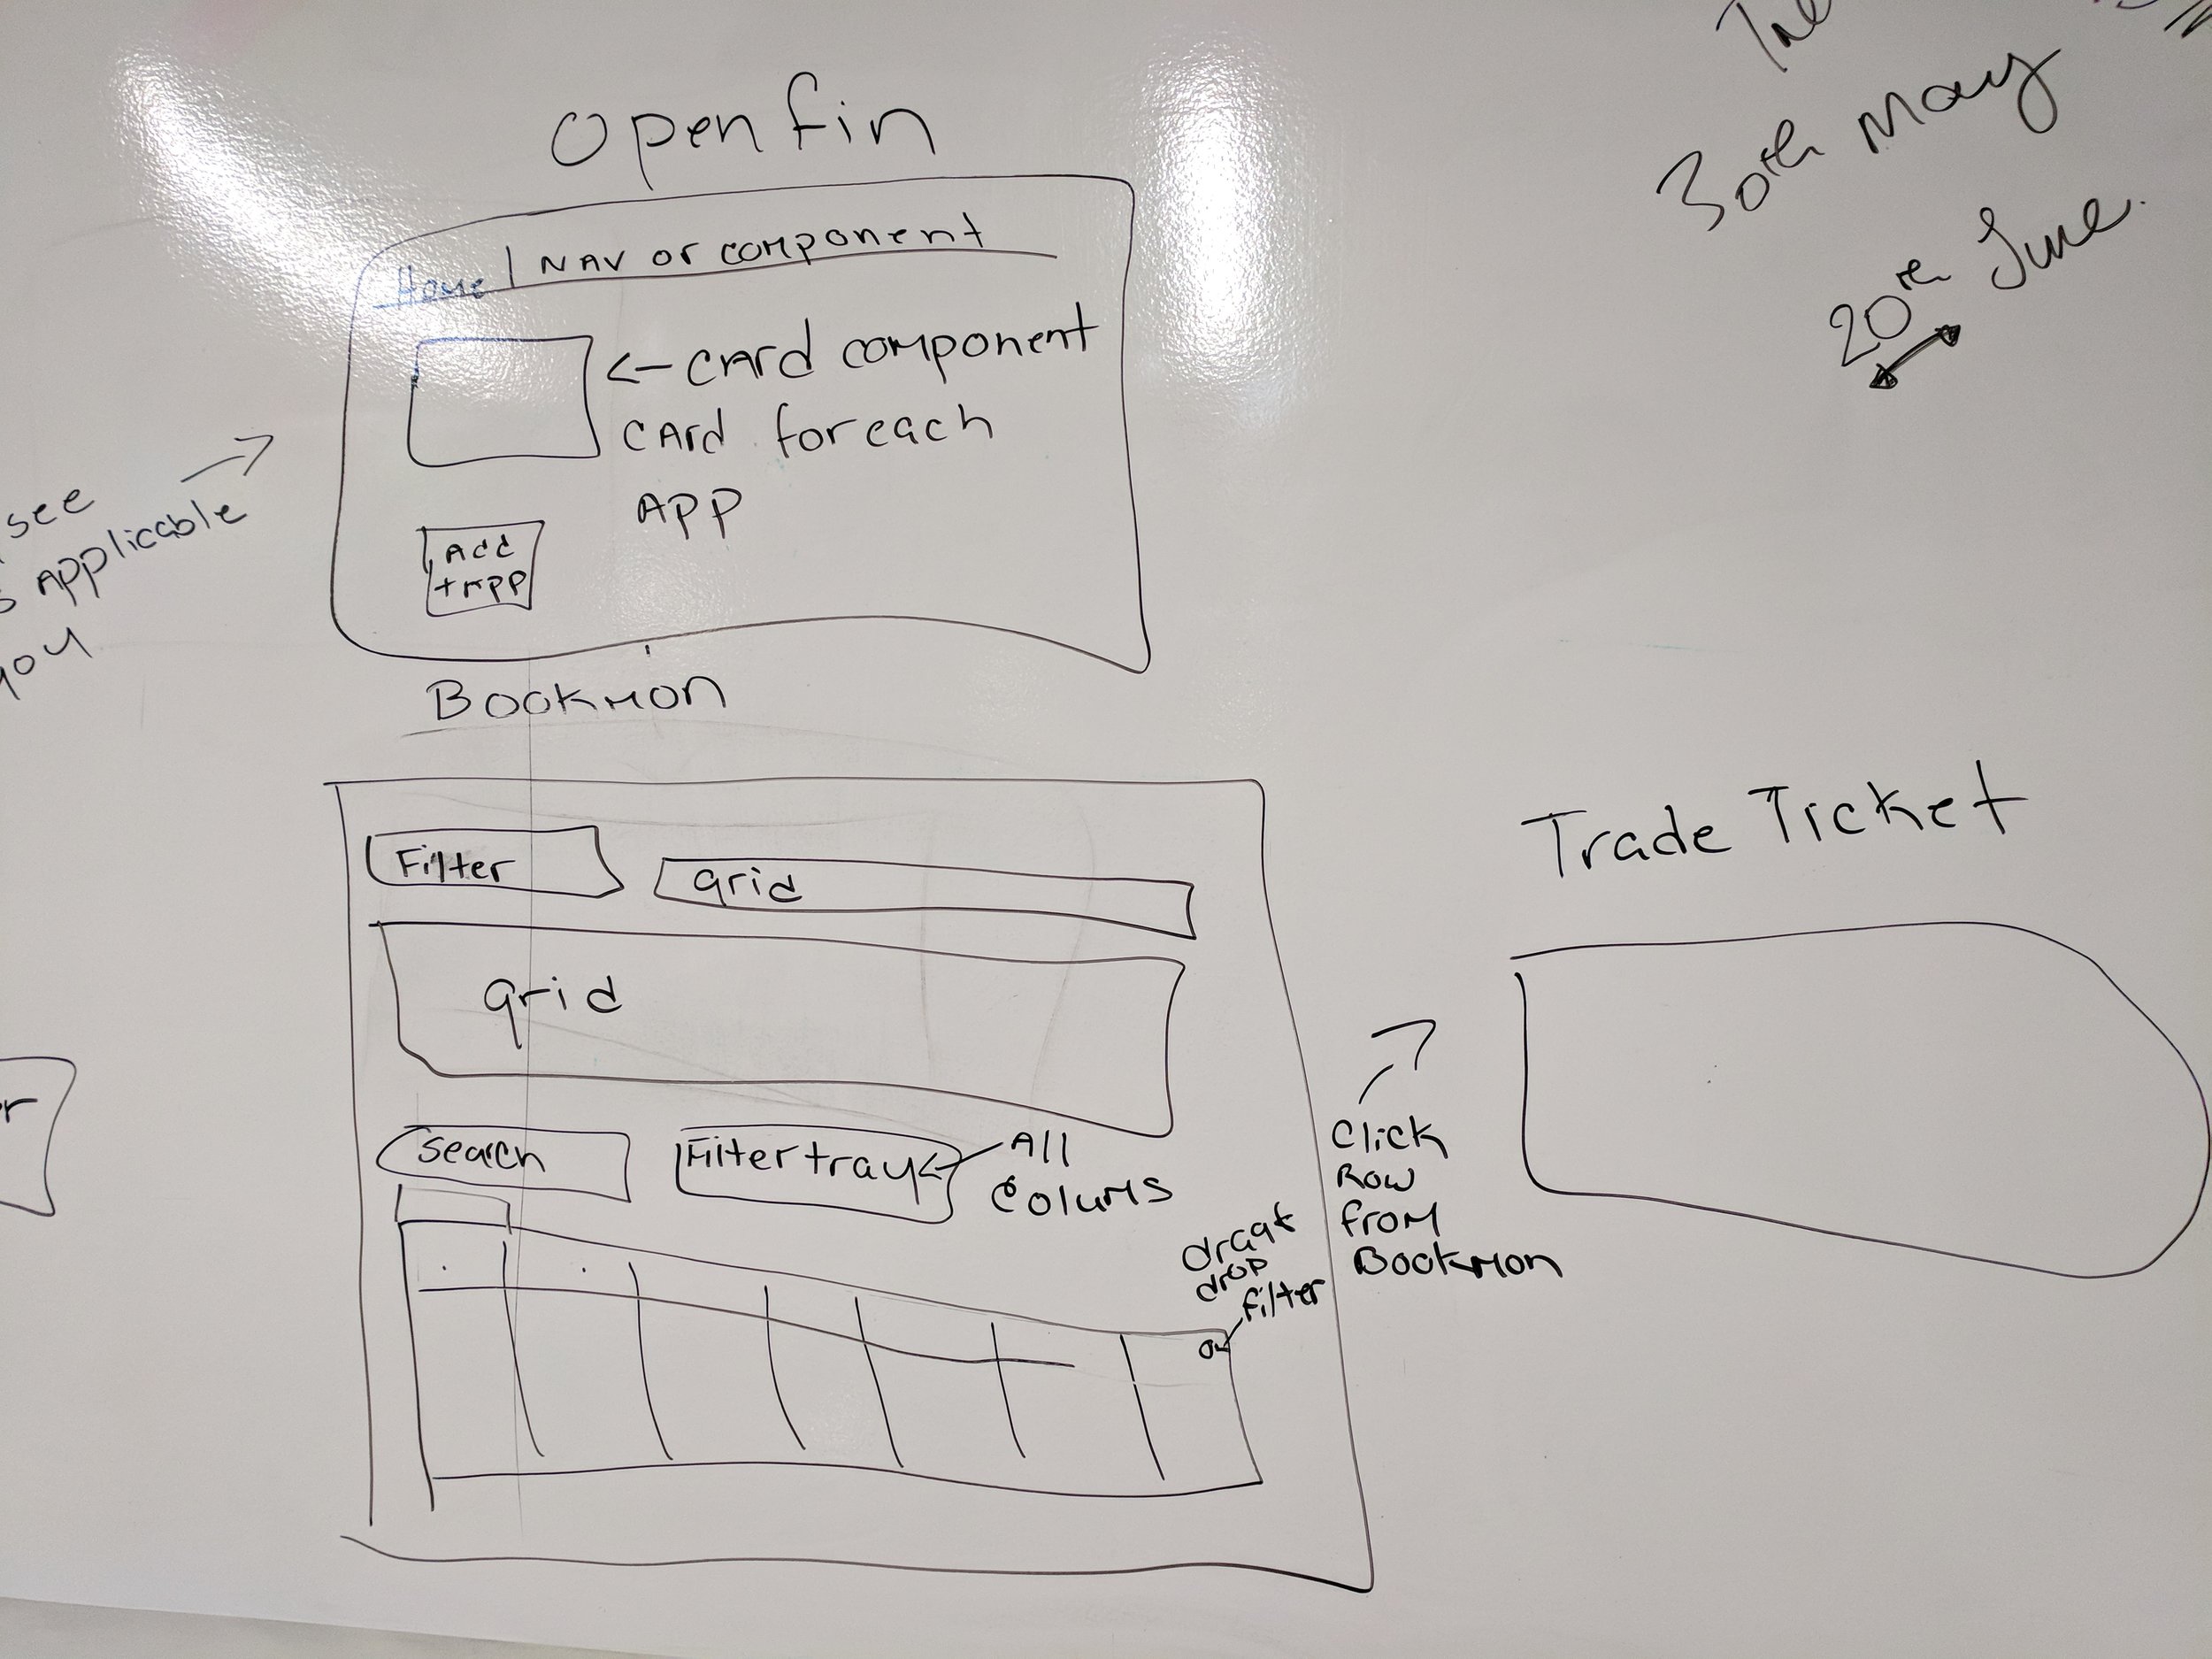
The developer and I analyzed the UI designs, and broke them down into components as we would be using Vue.js framework for the application development. We used Ag-grid, a JavaScript grid framework for the data tables; OpenFin for runtime and securitites.
Design Iterations
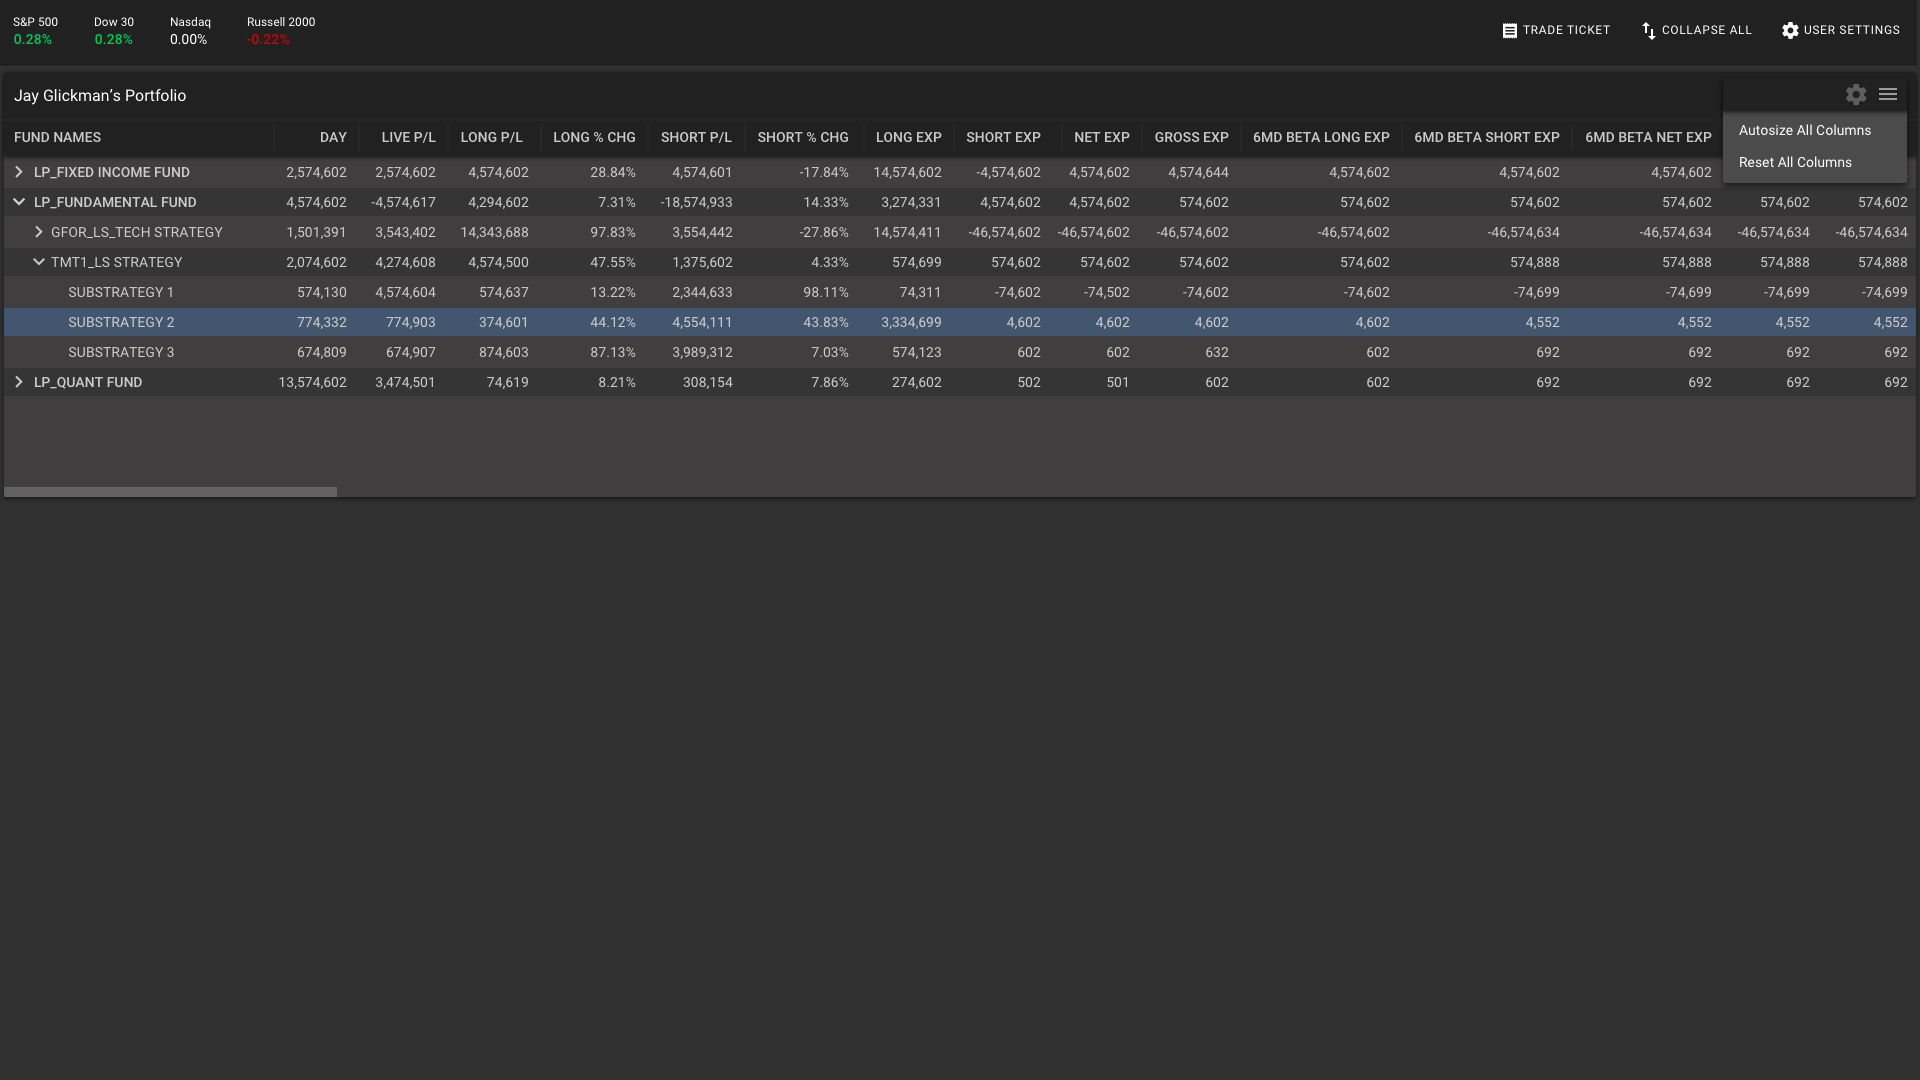
The first iteration of UI design is focused on the layout of data tables for portfolio manager. The main tasks for the portfolio can do are 1. monitoring funds performance, 2. viewing strategies and sub-strategies, 3. manipulating tables, and exporting them to spreadsheets.
1st Iteration
2nd Iteration
After getting feedback from the Business Analyst, the display is redesigned to accommodate management view as well. The tables layout can be customized based on user preference. The main change between the iterations is that filtering is customized for the table instead of each individual column.


Annotations
Prototype
The development is a few iterations behind the design, but you can view the prototype here.
Conclusion
Final Thoughts
**Update** This project is permanently on hold as client wants to work on a new project in Portfolio Margin (June 10th, 2018)
**Update** This project is currently on hold as the client is in the process of getting more funding (April 30th, 2018)
This page is actively updated as the project is still on-going. More details to come!